Cops and No Counselors


In the wake of high-profile school shootings, many schools over the past decade have invested scarce educational funds into putting more police in schools. School districts have shown a near obsession with ÔÇ£hardeningÔÇØ schools despite federal data revealing that the real crisis of schools isnÔÇÖt violence, but a broad failure to hire enough support staff to serve studentsÔÇÖ mental health needs.
TodayÔÇÖs students are experiencing record levels of depression and anxiety and many forms of trauma. According to the Centers for Disease Control and Prevention, the suicide rate among children ages 10 to 17 increased by 70 percent between 2006 and 2016. Approximately 72 percent of children in the United States will have experienced at least one major stressful event ÔÇö such as witnessing violence, experiencing abuse, or experiencing the loss of a loved one ÔÇö before the age of 18.
School counselors, nurses, social workers, and psychologists are frequently the first to see children who are sick, stressed, or traumatized ÔÇö especially in low-income districts. The benefits of investing in mental health services are clear: Schools with such services see improved attendance rates, better academic achievement, and higher graduation rates as well as lower rates of suspension, expulsion, and other disciplinary incidents. Data shows that the presence of school-based mental health providers not only improves outcomes for students, but can also improve overall school safety.
By contrast, there is no evidence that increased police presence in schools improves school safety. Indeed, in many cases, it causes harm. When in schools, police officers do what they are trained to do, which is detain, handcuff, and arrest. This leads to greater student alienation and a more threatening school climate.
The glaring deficit of mental health staff in schools is inexcusable, especially given the growing use of law enforcement in schools. This dangerous combination is a central reason the most vulnerable students are being funneled into the school-to-prison pipeline.
47 states and D.C. don't meet the recommended student-to-counselor ratio
Data Source: U.S. Department of Education, 2015-2016 Civil Rights Data Collection (CRDC)
Last updated on February 20, 2019
Alabama
Not Meeting Recommended Ratio
419:1
Alaska
Not Meeting Recommended Ratio
433:1
Arizona
Not Meeting Recommended Ratio
758:1
Arkansas
Not Meeting Recommended Ratio
370:1
California
Not Meeting Recommended Ratio
682:1
Colorado
Not Meeting Recommended Ratio
503:1
Connecticut
Not Meeting Recommended Ratio
326:1
Delaware
Not Meeting Recommended Ratio
424:1
Florida
Not Meeting Recommended Ratio
554:1
Georgia
Not Meeting Recommended Ratio
480:1
Hawaii
Not Meeting Recommended Ratio
292:1
Idaho
Not Meeting Recommended Ratio
479:1
Illinois
Not Meeting Recommended Ratio
555:1
Indiana
Not Meeting Recommended Ratio
532:1
Iowa
Not Meeting Recommended Ratio
378:1
Kansas
Not Meeting Recommended Ratio
407:1
Kentucky
Not Meeting Recommended Ratio
442:1
Louisiana
Not Meeting Recommended Ratio
Maine
Not Meeting Recommended Ratio
504:1
Maryland
Not Meeting Recommended Ratio
383:1
Massachusetts
Not Meeting Recommended Ratio
304:1
Michigan
Not Meeting Recommended Ratio
693:1
Minnesota
Not Meeting Recommended Ratio
5*2:1
Mississippi
Not Meeting Recommended Ratio
432:1
Missouri
Not Meeting Recommended Ratio
328:1
Montana
Meeting Recommended Ratio
207:1
Nebraska
Not Meeting Recommended Ratio
347:1
Nevada
Not Meeting Recommended Ratio
441:1
New Hampshire
Meeting Recommended Ratio
237:1
New Jersey
Not Meeting Recommended Ratio
321:1
New Mexico
Not Meeting Recommended Ratio
391:1
New York
Not Meeting Recommended Ratio
357:1
North Carolina
Not Meeting Recommended Ratio
370:1
North Dakota
Not Meeting Recommended Ratio
260:1
Ohio
Not Meeting Recommended Ratio
507:1
Oklahoma
Not Meeting Recommended Ratio
302:1
Oregon
Not Meeting Recommended Ratio
481:1
Pennsylvania
Not Meeting Recommended Ratio
380:1
Rhode Island
Not Meeting Recommended Ratio
392:1
South Carolina
Not Meeting Recommended Ratio
367:1
South Dakota
Not Meeting Recommended Ratio
306:1
Tennessee
Not Meeting Recommended Ratio
417:1
Texas
Not Meeting Recommended Ratio
434:1
Utah
Not Meeting Recommended Ratio
663:1
Vermont
Meeting Recommended Ratio
207:1
Virginia
Not Meeting Recommended Ratio
346:1
Washington
Not Meeting Recommended Ratio
448:1
West Virginia
Not Meeting Recommended Ratio
365:1
Wisconsin
Not Meeting Recommended Ratio
393:1
Wyoming
Not Meeting Recommended Ratio
304:1
Given the clear benefits of investing in school mental health resources, it would make sense for school boards, school principals, and government leaders to be using every available resource to increase school-based health professionals. Yet, that has not been the trend. Instead, funding for police in schools has been on the rise, while public schools face a critical shortage of counselors, nurses, psychologists, and social workers. As this report reveals, millions of students are in schools with law enforcement but no support staff:
- 1.7 million students are in schools with police but no counselors
- 3 million students are in schools with police but no nurses
- 6 million students are in schools with police but no school psychologists
- 10 million students are in schools with police but no social workers
- 14 million students are in schools with police but no counselor, nurse, psychologist, or social worker
Even schools offering some mental health services are still grossly understaffed. Professional standards recommended at least one counselor and one social worker for every 250 students and at least one nurse and one psychologist for every 750 students and every 700 students respectively. These staffing recommendations reflect a minimum requirement.
Nonetheless, our report shows that 90 percent of students are in public schools that fail to meet these standards. Yet in those schools with a significant lack of health support staff, law enforcement presence is flourishing. Many states reported two to three times as many police officers in schools as social workers. Five states reported more police officers in schools than nurses.
Read the Full Report
The U.S. Department of Education recently required every public school to report the number of social workers, nurses, and psychologists employed...
Source: └¤░─├┼┐¬¢▒¢ß╣¹
The consequences for these funding decisions fall on the most vulnerable students. Historically marginalized students ÔÇö such as students of color ÔÇö often have to attend schools with fewer resources and supports, and teachers are often not equipped to deal with the special needs of children with disabilities. When there are no other support staff to address behavioral problems, some teachers request help from law enforcement. This results in an increased criminalization of school children: We found that schools with police reported 3.5 times as many arrests as schools without police. As a result, students with disabilities and students of color are frequently sent into the criminal system.

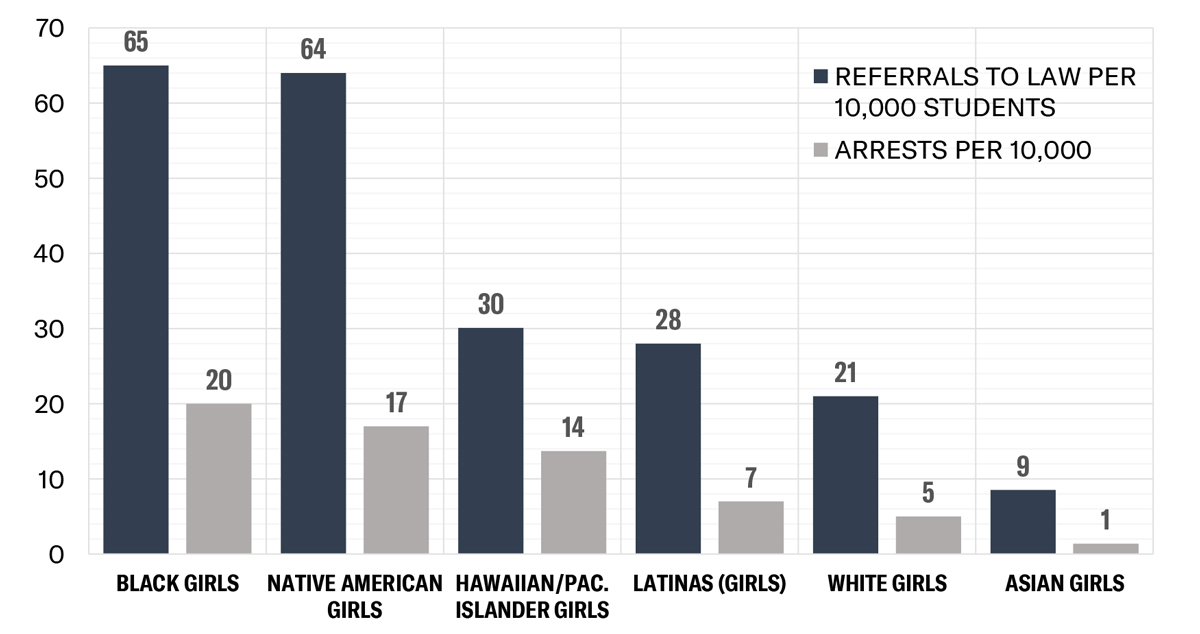
School Arrests and Referrals to Law Enforcement for Girls
Data Source: U.S. Department of Education, 2015-2016 Civil Rights Data Collection (CRDC)
Mental Health and Schools
According to the Centers for Disease Control, the suicide rate among children ages 10 to 17 increased by 70 percent between 2006 and 2016. It is estimated that nearly 35 million children in the U.S. have experienced at least one event that could lead to childhood trauma. └¤░─├┼┐¬¢▒¢ß╣¹ 72 percent of children in the U.S. will have experienced at least one traumatic event such as witnessing violence, experiencing abuse, or experiencing the loss of a loved one before the age of 18.
The majority of mental health needs first emerge during adolescence and are most effectively treated during this period. The data suggestes 1 in 5 youth will develop mental health difficulties, eventually warranting a diagnosis, and 1 in 10 youth will be affected by their mental health needs enough to require additional support services from schools. These mental health concerns can have serious impacts on students as they progress through school, and it contributes to nearly half of the youth eventually dropping out.
Up to 80 percent of youth in need of mental health services do not receive services in their communities because existing services are inadequate. Of those who do receive assistance, 70 to 80 percent of youth receive mental health care in their schools. Students are 21 times more likely to visit school-based health centers for mental health than community mental health centers. This is especially true in low-income districts where other resources are scarce. Therefore, school-based mental health providers (SBMH providers) ÔÇö such as school counselors, nurses, social workers, and psychologists ÔÇö are frequently the first to see children who are sick, stressed, traumatized, or hurt themselves or others.
Majority of states don't meet the recommended student-to-nurse ratios
Data Source: U.S. Dept. of Education, 2015-2016 Civil Rights Data Collection
Last updated on February 5, 2024
Alabama
Meeting Recommended Ratio
588:1
Alaska
Not Meeting Recommended Ratio
813:1
Arizona
Not Meeting Recommended Ratio
1,294:1
Arkansas
Meeting Recommended Ratio
526:1
California
Not Meeting Recommended Ratio
1,482:1
Colorado
Not Meeting Recommended Ratio
2,853:1
Connecticut
Meeting Recommended Ratio
435:1
Delaware
Meeting Recommended Ratio
532:1
Georgia
Not Meeting Recommended Ratio
1,288:1
Idaho
Not Meeting Recommended Ratio
1,857:1
Illinois
Not Meeting Recommended Ratio
871:1
Indiana
Not Meeting Recommended Ratio
755:1
Iowa
Meeting Recommended Ratio
625:1
Kansas
Meeting Recommended Ratio
636:1
Kentucky
Not Meeting Recommended Ratio
921:1
Louisiana
Not Meeting Recommended Ratio
923:1
Maine
Meeting Recommended Ratio
503:1
Maryland
Not Meeting Recommended Ratio
917:1
Massachusetts
Meeting Recommended Ratio
480:1
Michigan
Not Meeting Recommended Ratio
4199:1
Minnesota
Not Meeting Recommended Ratio
928:1
Mississippi
Not Meeting Recommended Ratio
942:1
Missouri
Meeting Recommended Ratio
488:1
Montana
Meeting Recommended Ratio
707:1
Nebraska
Meeting Recommended Ratio
676:1
Nevada
Not Meeting Recommended Ratio
1,743:1
New Hampshire
Meeting Recommended Ratio
407:1
New Jersey
Meeting Recommended Ratio
484:1
New Mexico
Meeting Recommended Ratio
695:1
New York
Meeting Recommended Ratio
542:1
North Carolina
Not Meeting Recommended Ratio
1,259:1
North Dakota
Not Meeting Recommended Ratio
2,453:1
Ohio
Not Meeting Recommended Ratio
991:1
Oklahoma
Not Meeting Recommended Ratio
1:312
Oregon
Not Meeting Recommended Ratio
4,112:1
Pennsylvania
Meeting Recommended Ratio
667:1
Rhode Island
Meeting Recommended Ratio
516:1
South Carolina
Meeting Recommended Ratio
631:1
South Dakota
Not Meeting Recommended Ratio
876:1
Tennessee
Not Meeting Recommended Ratio
806:1
Texas
Not Meeting Recommended Ratio
831:1
Utah
Not Meeting Recommended Ratio
4,479:1
Vermont
Meeting Recommended Ratio
324:1
Virginia
Not Meeting Recommended Ratio
817:1
Washington
Not Meeting Recommended Ratio
1,830:1
West Virginia
Not Meeting Recommended Ratio
972:1
Wisconsin
Not Meeting Recommended Ratio
1,284:1
Wyoming
Meeting Recommended Ratio
533:1
Research has shown that the presence of school-based mental health providers can result in positive outcomes for students and improve school safety generally. These schools have seen improved attendance rates, improved academic achievement and career preparation, improved graduation rates, and fewer disciplinary incidents and lower suspension and expulsion rates.
Police and Schools
No data indicates that police in schools improve student safety, student educational outcomes, or student mental health. For example, a recent evaluation of the impact of North CarolinaÔÇÖs state grant program for school-based police officers (called school resource officers) concluded that middle schools that used state grants to hire and train SROs did not report reductions in serious incidents like assaults, homicide, bomb threats, possession and use of alcohol and drugs, or the possession of weapons. In fact, there is some evidence suggesting that the SRO presence actually harms youth.
Research has indicated that having school-based police contributes to less inclusive school climates, and this makes students less safe. A 2018 study reviewing the impact of federal grants for school police on 2.5 million students in Texas found a 6 percent increase in middle school discipline rates, a 2.5 percent decrease in high school graduation rates, and a 4 percent decrease in college enrollment rates. Another 2018 study found more police in New York City neighborhoods hurt the test scores of Black male students.
Increased police presence in schools results in an expansion in the types of roles police play in schools, an increase in student referrals to police, an increase in student arrests, and accountability problems from student-police contact. The presence of police shifts the focus from learning and supporting students to over-disciplining and criminalizing them. Students are removed from classes, subjected to physical restraint, interrogation, and other risks to their rights to education, due process, and equal treatment.

Data from the National Center for Education Statistics also indicates a racial disparity in the effect of police in schools. Police in schools with predominantly students of color are significantly more likely to focus on maintaining school discipline compared to police in predominately white schools, while being less likely to coordinate with emergency teams in the presence of an actual threat.
Moreover, law enforcement officers are often not qualified to work with children. Roughly 25 percent of school police surveyed by Education Week stated that they had no experience with youth before working in schools. Police are trained to focus on law and order, not student social and emotional well-being. This lack of training undermines effective behavior management. The tools of law enforcement ÔÇö pepper spray, handcuffs, tasers, and guns ÔÇö are ill-suited to the classroom. A 2018 report by the Advancement Project documented and mapped over 60 instances of police brutality in schools over the past eight years.
Racial Disparities
The use of police in schools has its roots in the fear and animus of desegregation. Students of color are more likely to go to a school with a law enforcement officer, more likely to be referred to law enforcement, and more likely to be arrested at school. Research also demonstrates that students who attend schools with high percentages of Black students and students from low-income families are more likely face security measures like metal detectors, random ÔÇ£contrabandÔÇØ sweeps, security guards, and security cameras, even when controlling for the level of misconduct in schools or violence in school neighborhoods.
Black girls are 4X more likely to be arrested in school than white girls nationally
Data Source: U.S. Dept. of Education, 2015-2016 Civil Rights Data Collection
Last updated on February 20, 2019
Alabama
4-5 X as likely to be arrested as white girls.
Alaska
0-1 X as likely to be arrested as white girls.
Arizona
2-3 X as likely to be arrested as white girls.
Arkansas
2-3 X as likely to be arrested as white girls.
California
6-7 X as likely to arrested as white girls.
Colorado
2-3 X as likely to be arrested as white girls.
Connecticut
6-7 X as likely to arrested as white girls.
Delaware
2-3 X as likely to be arrested as white girls.
District of Columbia
0-1 X as likely to be arrested as white girls.
Florida
2-3 X as likely to be arrested as white girls.
Georgia
2-3 X as likely to be arrested as white girls.
Hawaii
2-3 X as likely to be arrested as white girls.
Idaho
0-1 X as likely to be arrested as white girls.
Illinois
4-5 X as likely to be arrested as white girls.
Indiana
2-3 X as likely to be arrested as white girls.
Iowa
8+ X as likely to be arrested as white girls.
Kansas
4-5 X as likely to be arrested as white girls.
Kentucky
6-7 X as likely to arrested as white girls.
Louisiana
6-7 X as likely to arrested as white girls.
Maine
0-1 X as likely to be arrested as white girls.
Maryland
2-3 X as likely to be arrested as white girls.
Massachusetts
4-5 X as likely to be arrested as white girls.
Michigan
8+ X as likely to be arrested as white girls.
Minnesota
4-5 X as likely to be arrested as white girls.
Mississippi
2-3 X as likely to be arrested as white girls.
Missouri
4-5 X as likely to be arrested as white girls.
Montana
0-1 X as likely to be arrested as white girls.
Nebraska
0-1 X as likely to be arrested as white girls.
Nevada
0-1 X as likely to be arrested as white girls.
New Hampshire
6-7 X as likely to arrested as white girls.
New Jersey
4-5 X as likely to be arrested as white girls.
New Mexico
2-3 X as likely to be arrested as white girls.
New York
2-3 X as likely to be arrested as white girls.
North Carolina
8+ X as likely to be arrested as white girls.
North Dakota
6-7 X as likely to arrested as white girls.
Ohio
2-3 X as likely to be arrested as white girls.
Oklahoma
2-3 X as likely to be arrested as white girls.
Oregon
0-1 X as likely to be arrested as white girls.
Pennsylvania
4-5 X as likely to be arrested as white girls.
Rhode Island
6-7 X as likely to arrested as white girls.
South Carolina
2-3 X as likely to be arrested as white girls.
South Dakota
0-1 X as likely to be arrested as white girls.
Tennessee
2-3 X as likely to be arrested as white girls.
Texas
4-5 X as likely to be arrested as white girls.
Utah
0-1 X as likely to be arrested as white girls.
Vermont
4-5 X as likely to be arrested as white girls.
Virginia
2-3 X as likely to be arrested as white girls.
Washington
0-1 X as likely to be arrested as white girls.
West Virginia
8+ X as likely to be arrested as white girls.
Wisconsin
6-7 X as likely to arrested as white girls.
Wyoming
0-1 X as likely to be arrested as white girls.
Students With Disabilities
Students with disabilities are disproportionately arrested and physically harmed by school police as well. Overall, students with disabilities were nearly three times more likely to be arrested than students without disabilities, and the risk is multiplied at schools with police.

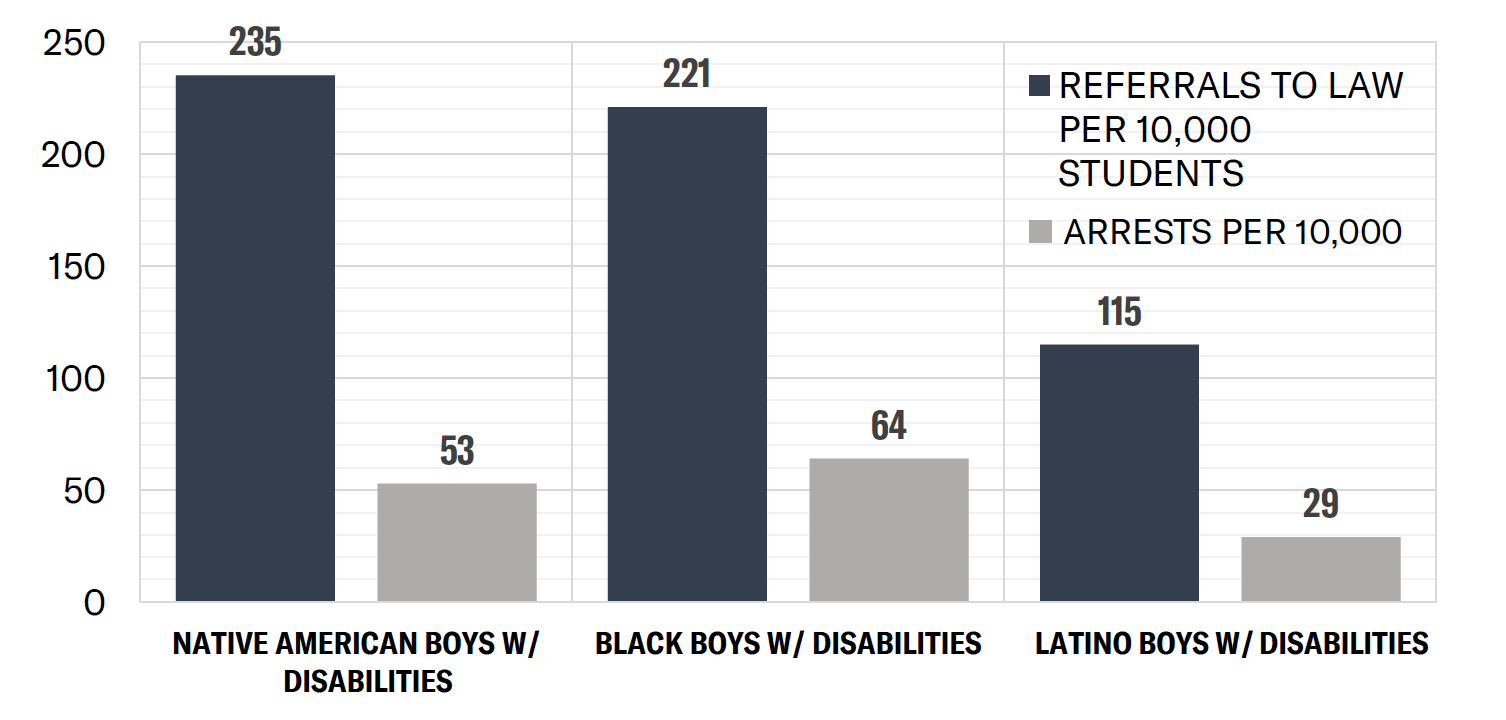
School Arrests and Referrals to Law Enforcement for Boys of Color with Disabilities
Data Source: U.S. Department of Education, 2015-2016 Civil Rights Data Collection (CRDC)
Our report found that Black boys with disabilities suffered an arrest rate 5 times the rate for all students. In nine states, their arrest rate was 10 or more times higher than the national rate for all students. Latino boys with disabilities also had school arrest rates 10 times higher than the rates for all students in three different states. Black and Latino boys with disabilities were only 3 percent of student enrollment nationally, but they comprised 12 percent of all student arrests.
Read the Full Report
The U.S. Department of Education recently required every public school to report the number of social workers, nurses, and psychologists employed...
Source: └¤░─├┼┐¬¢▒¢ß╣¹


