Decarceration and Crime During COVID-19
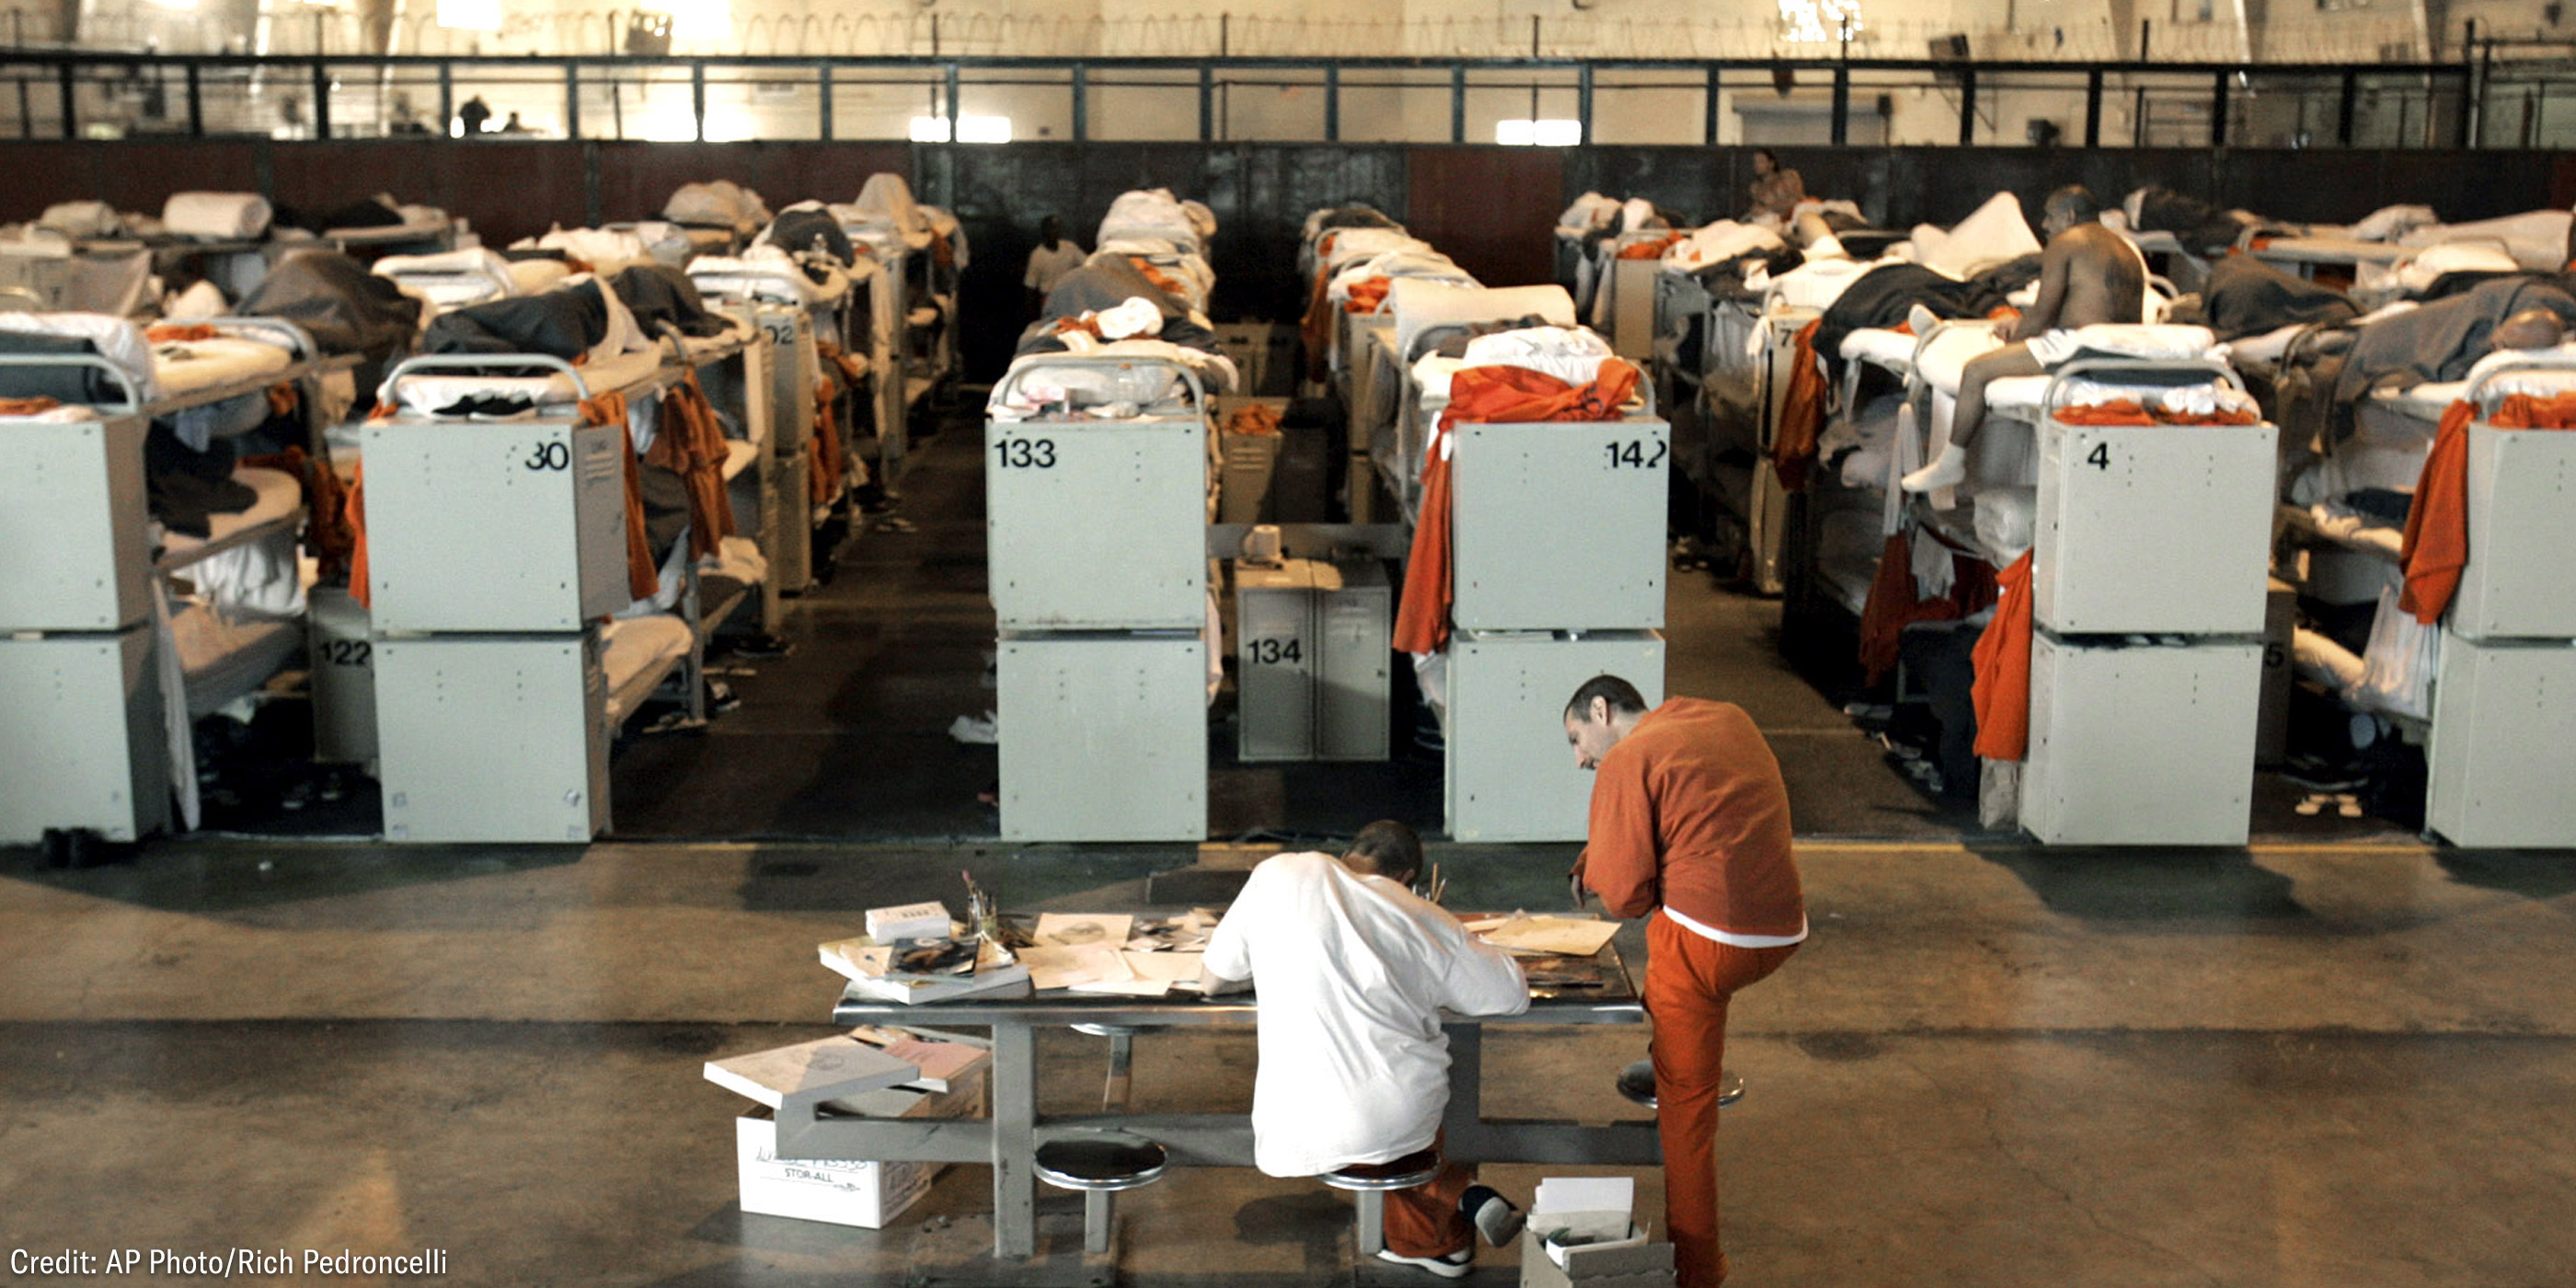
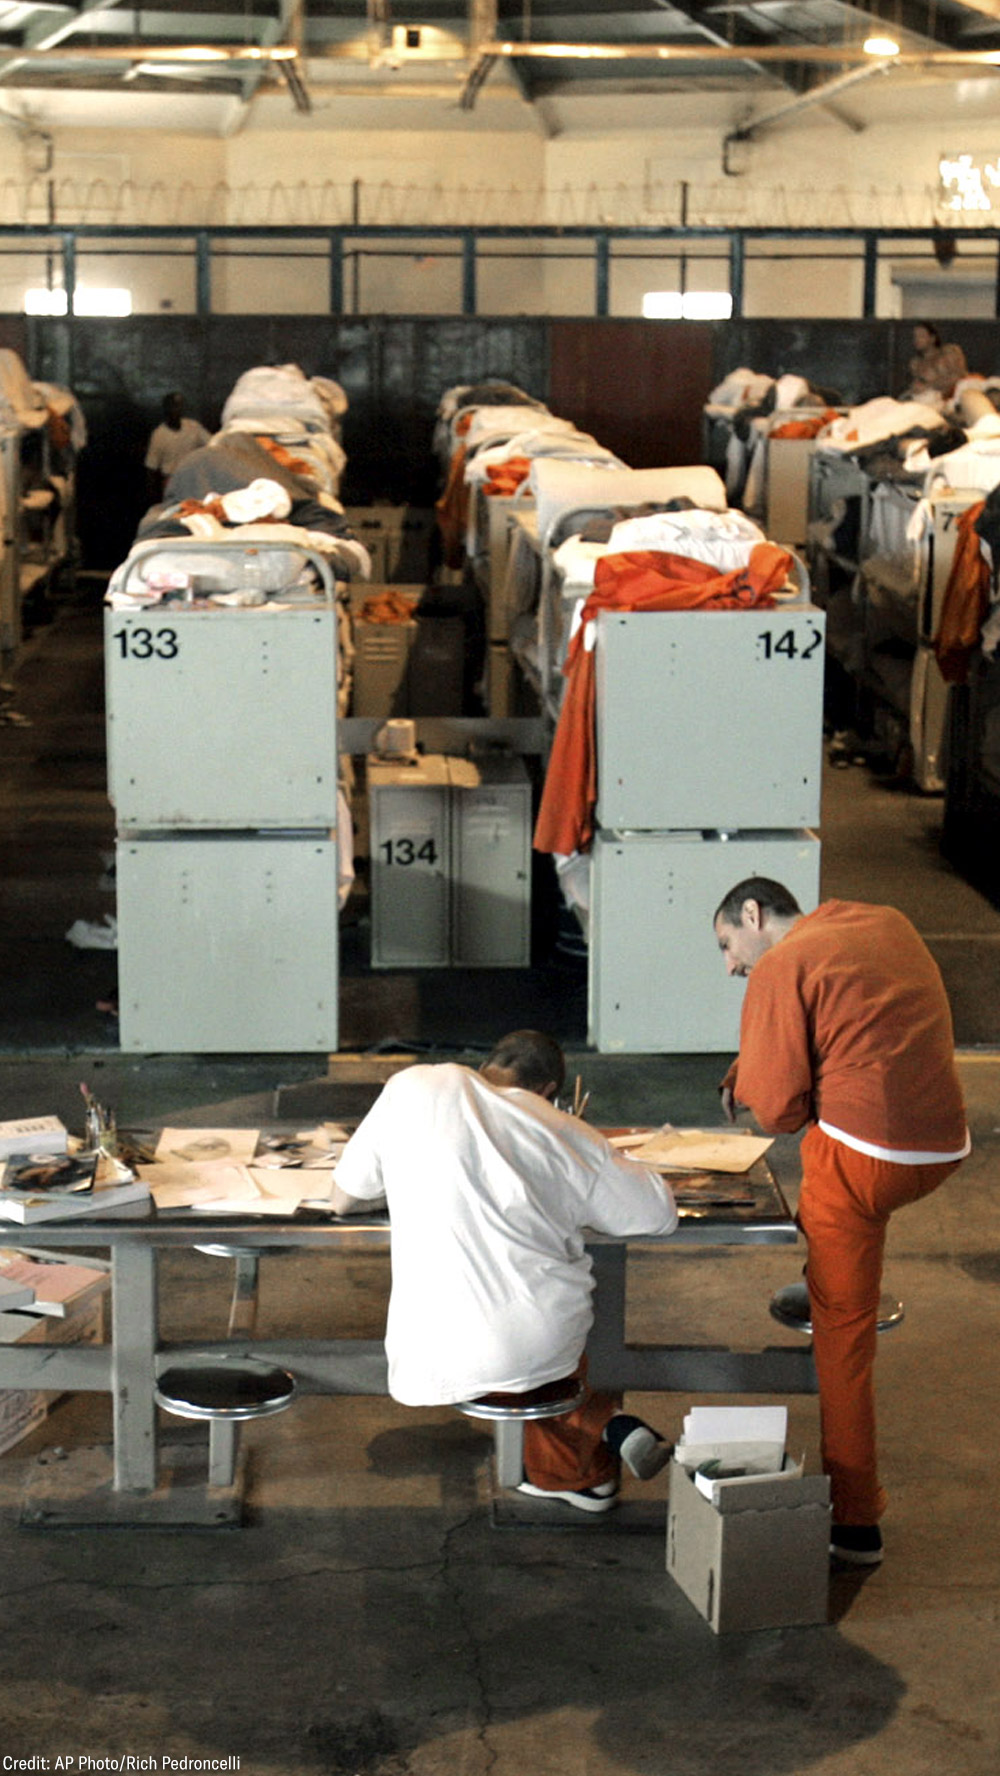
COVID-19 presents an enormous risk to those in carceral facilities and their surrounding communities. Since the pandemic began, more than 50,000 people in prison have tested positive for the coronavirus, and over 600 have died. These infections and deaths were largely preventable, as we demonstrated in April by working with academic partners to build an epidemiological model that illustrated the deadly threat of COVID-19 in jails. In response to this crisis ‚ÄĒ and in many localities, only after substantial public pressure and threats of litigation ‚ÄĒ some governors, sheriffs, and judges made the decision to shift detention policies to prioritize protecting the lives of those who live and work in jails and prisons. Some states and localities , or set bail to $0 for . Others released a small subset of incarcerated people who were nearing the end of their term or were most vulnerable to the disease ‚ÄĒ sometimes under .
While no jail system has gone far enough, county jails and state prison systems across the U.S. have taken differing levels of action, allowing for a unique opportunity to explore the relationship between decarceration and crime in the community. To explore this, the ņŌįń√ŇŅ™ĹĪĹŠĻŻ‚Äôs Analytics team looked for data on jail population and crime in locations with the largest jail and overall populations. We were able to find reported data on both from 29 localities. (Crime data more recent than May was not readily available during analysis.)
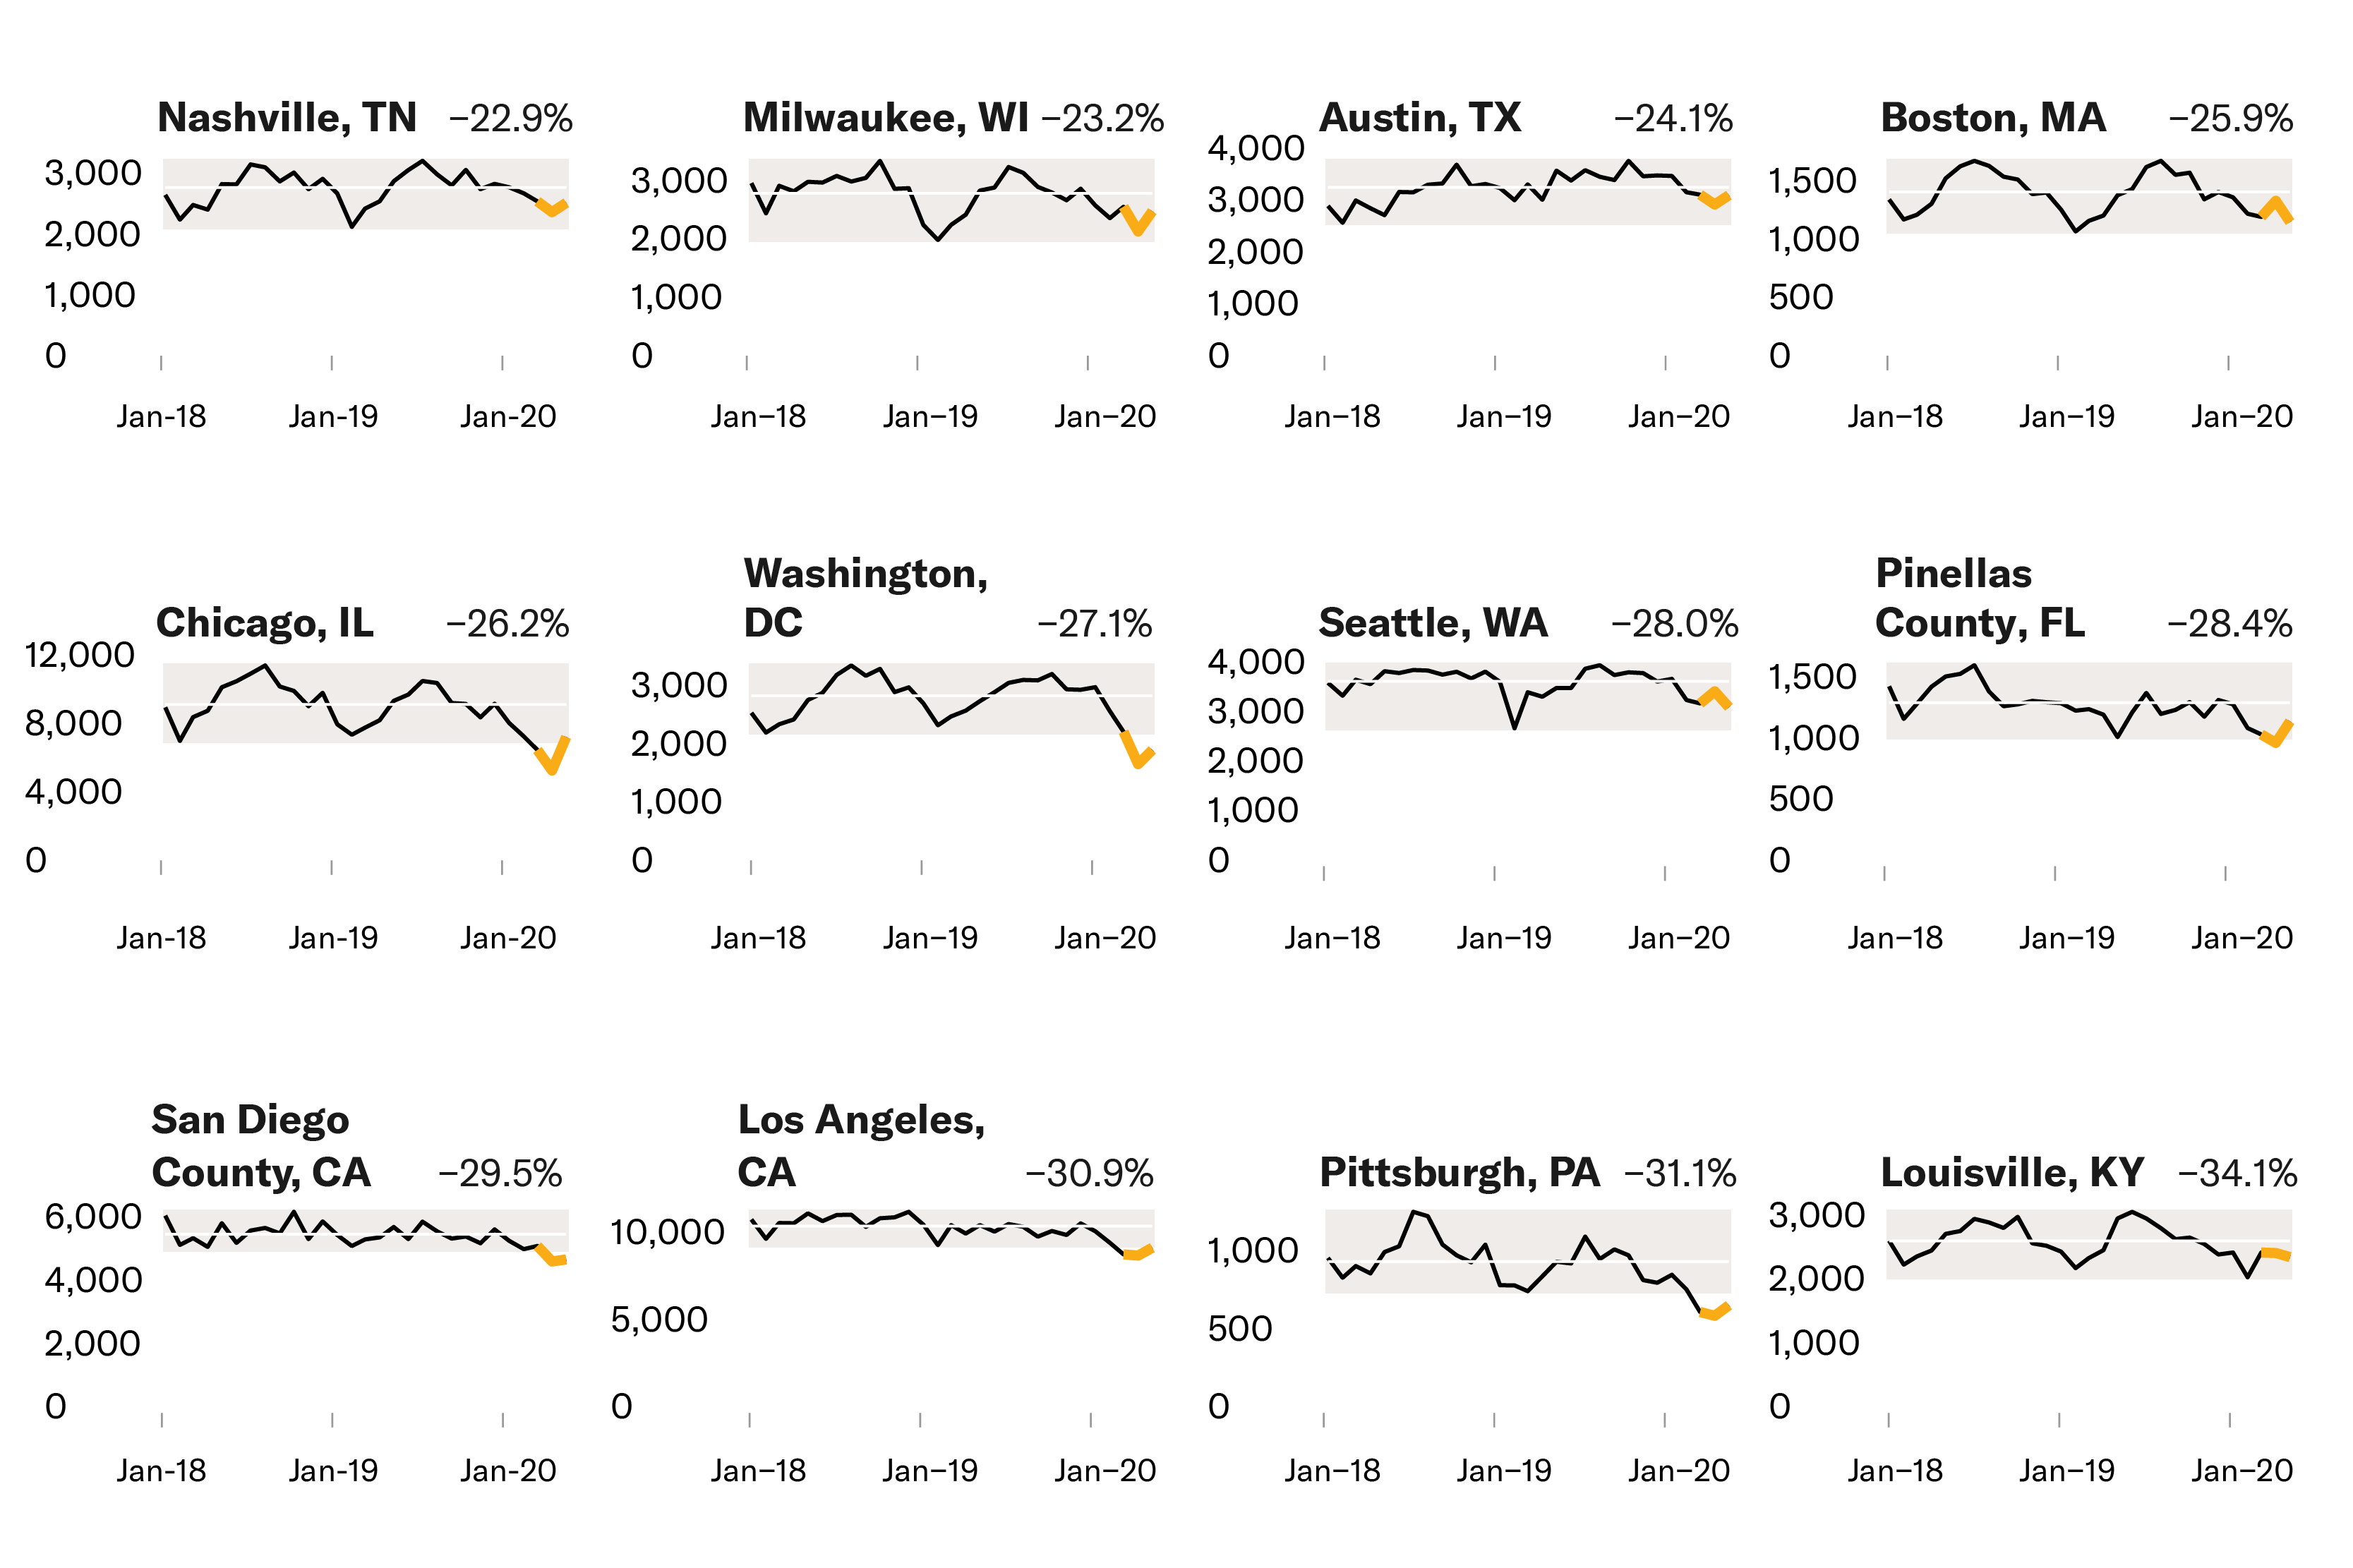
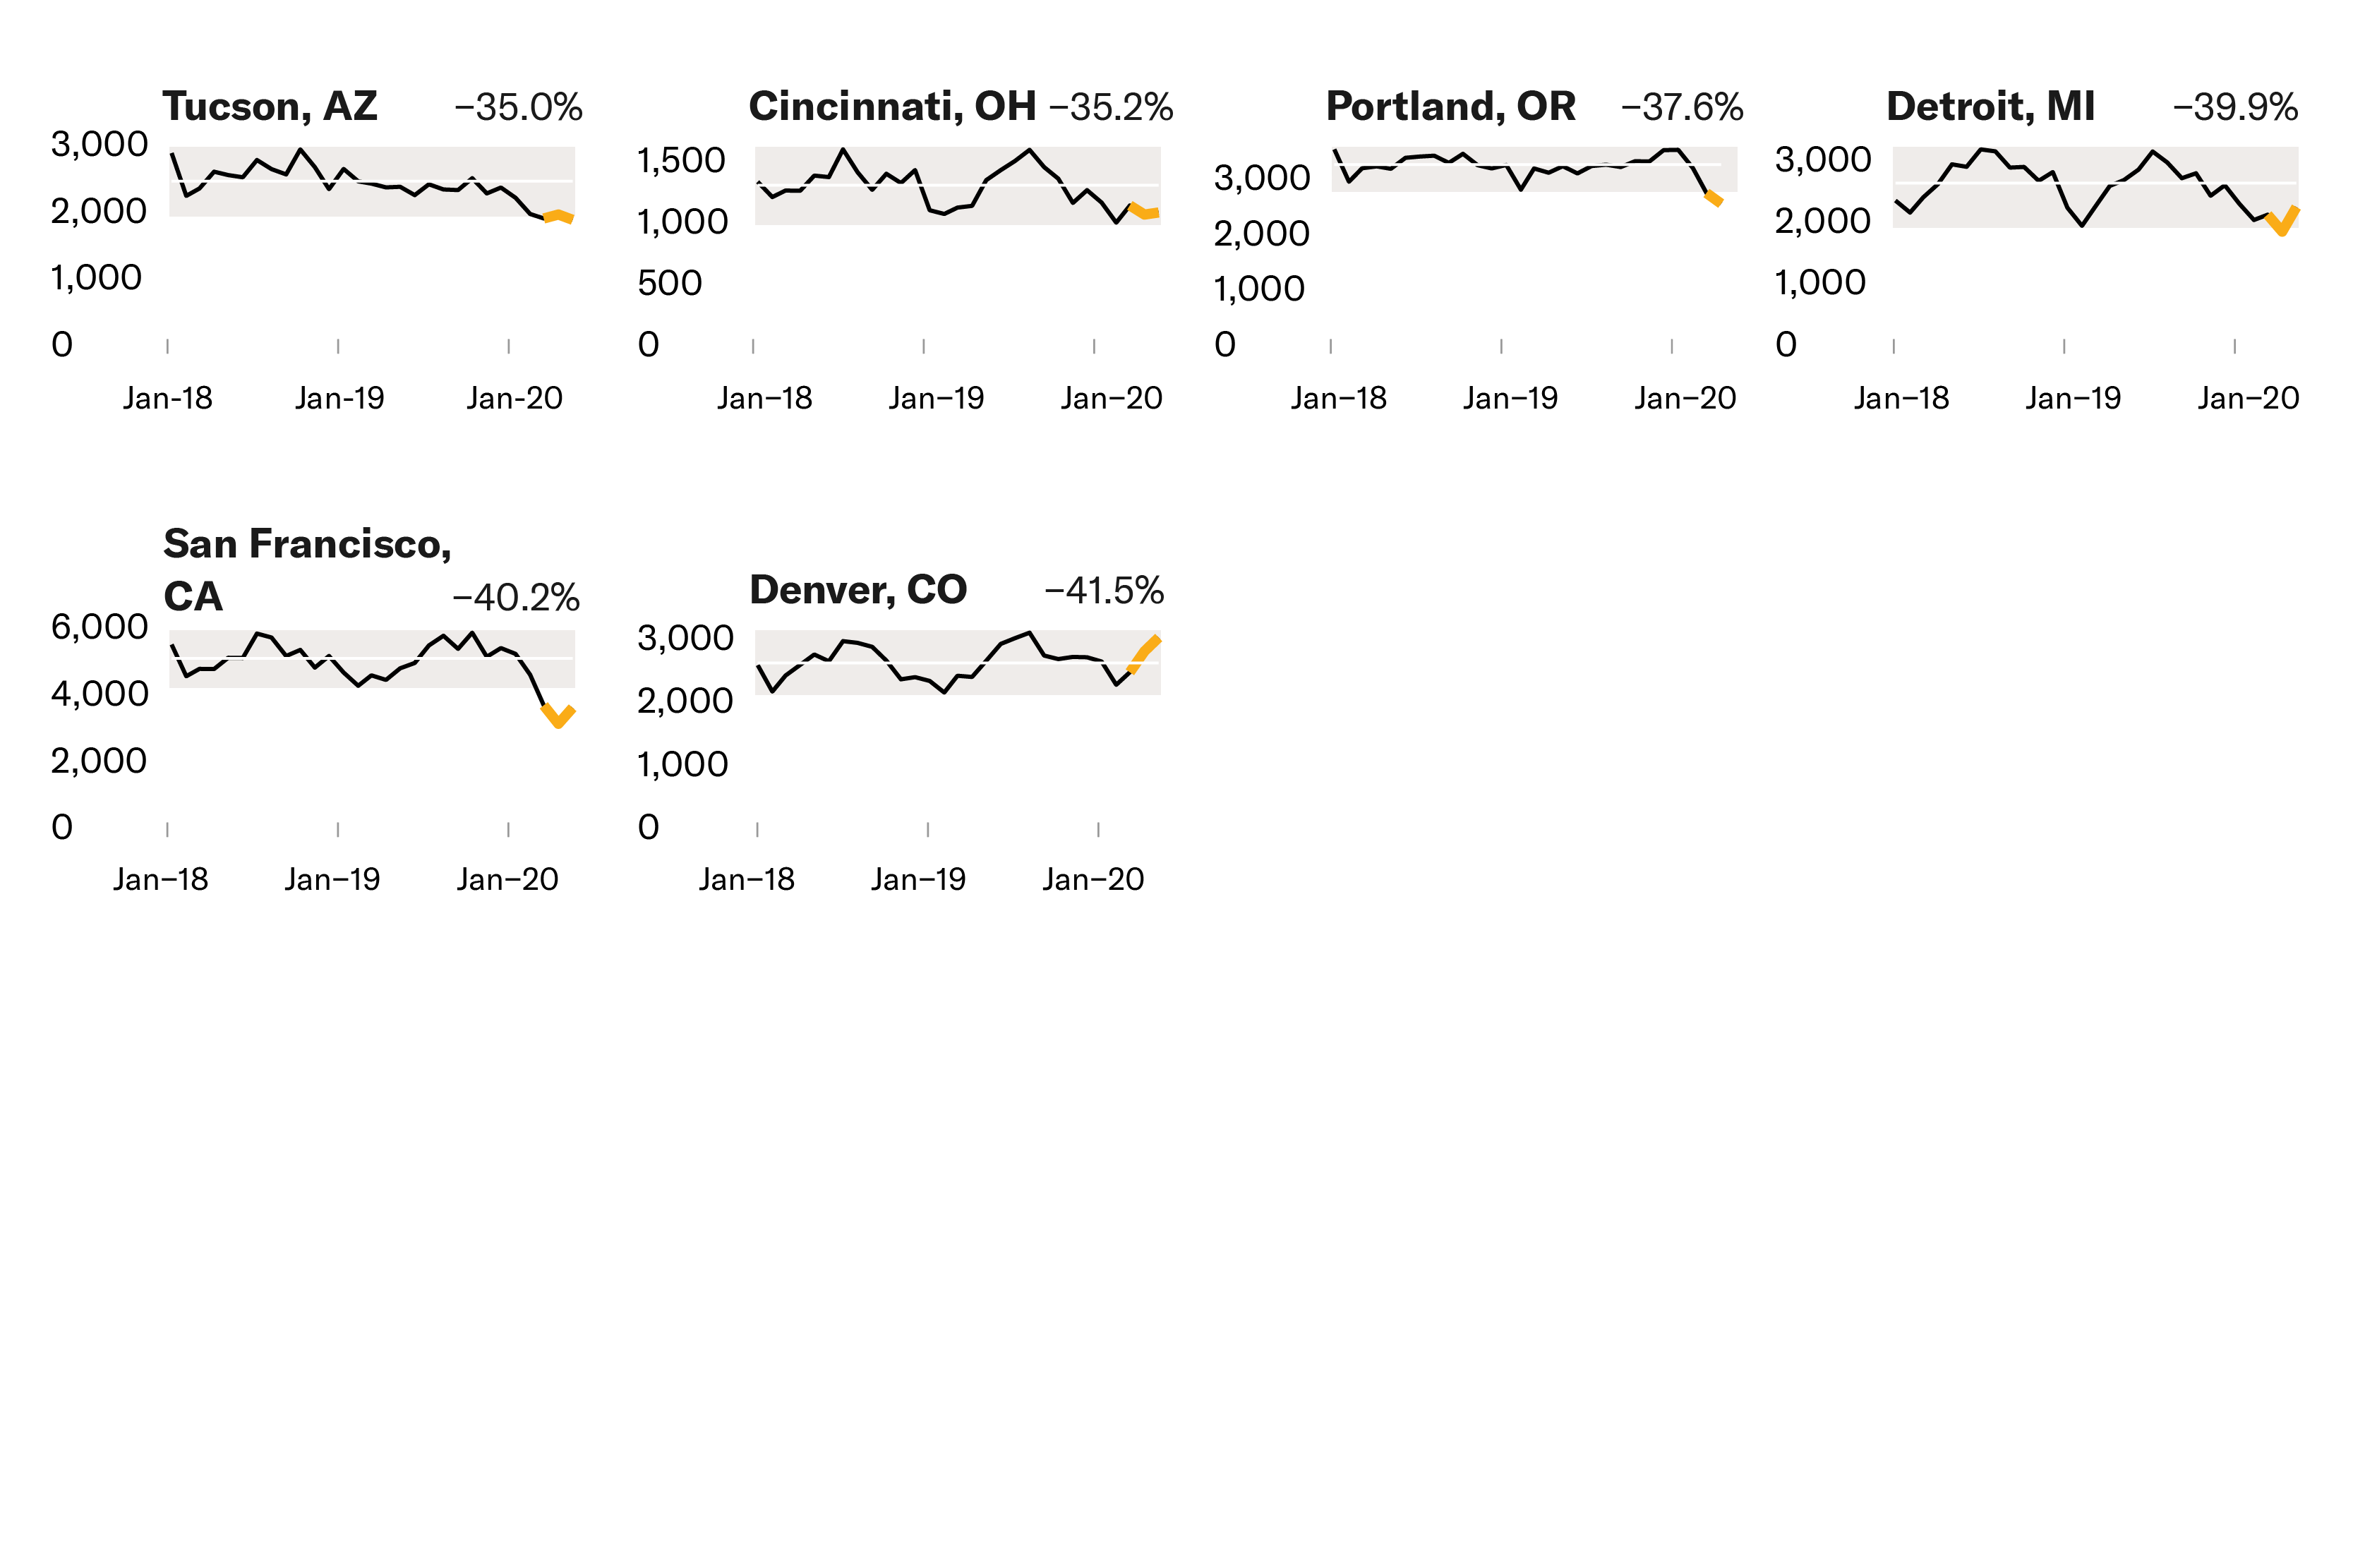
Nearly every county jail that we examined reduced their population, if only slightly, between the end of February and the end of April. Over this time period, we found that the reduction in jail population was functionally unrelated to crime trends in the following months. In fact, in nearly every city explored, fewer crimes occurred between March and May in 2020 compared to the same time period in 2019, regardless of the magnitude of the difference in jail population.
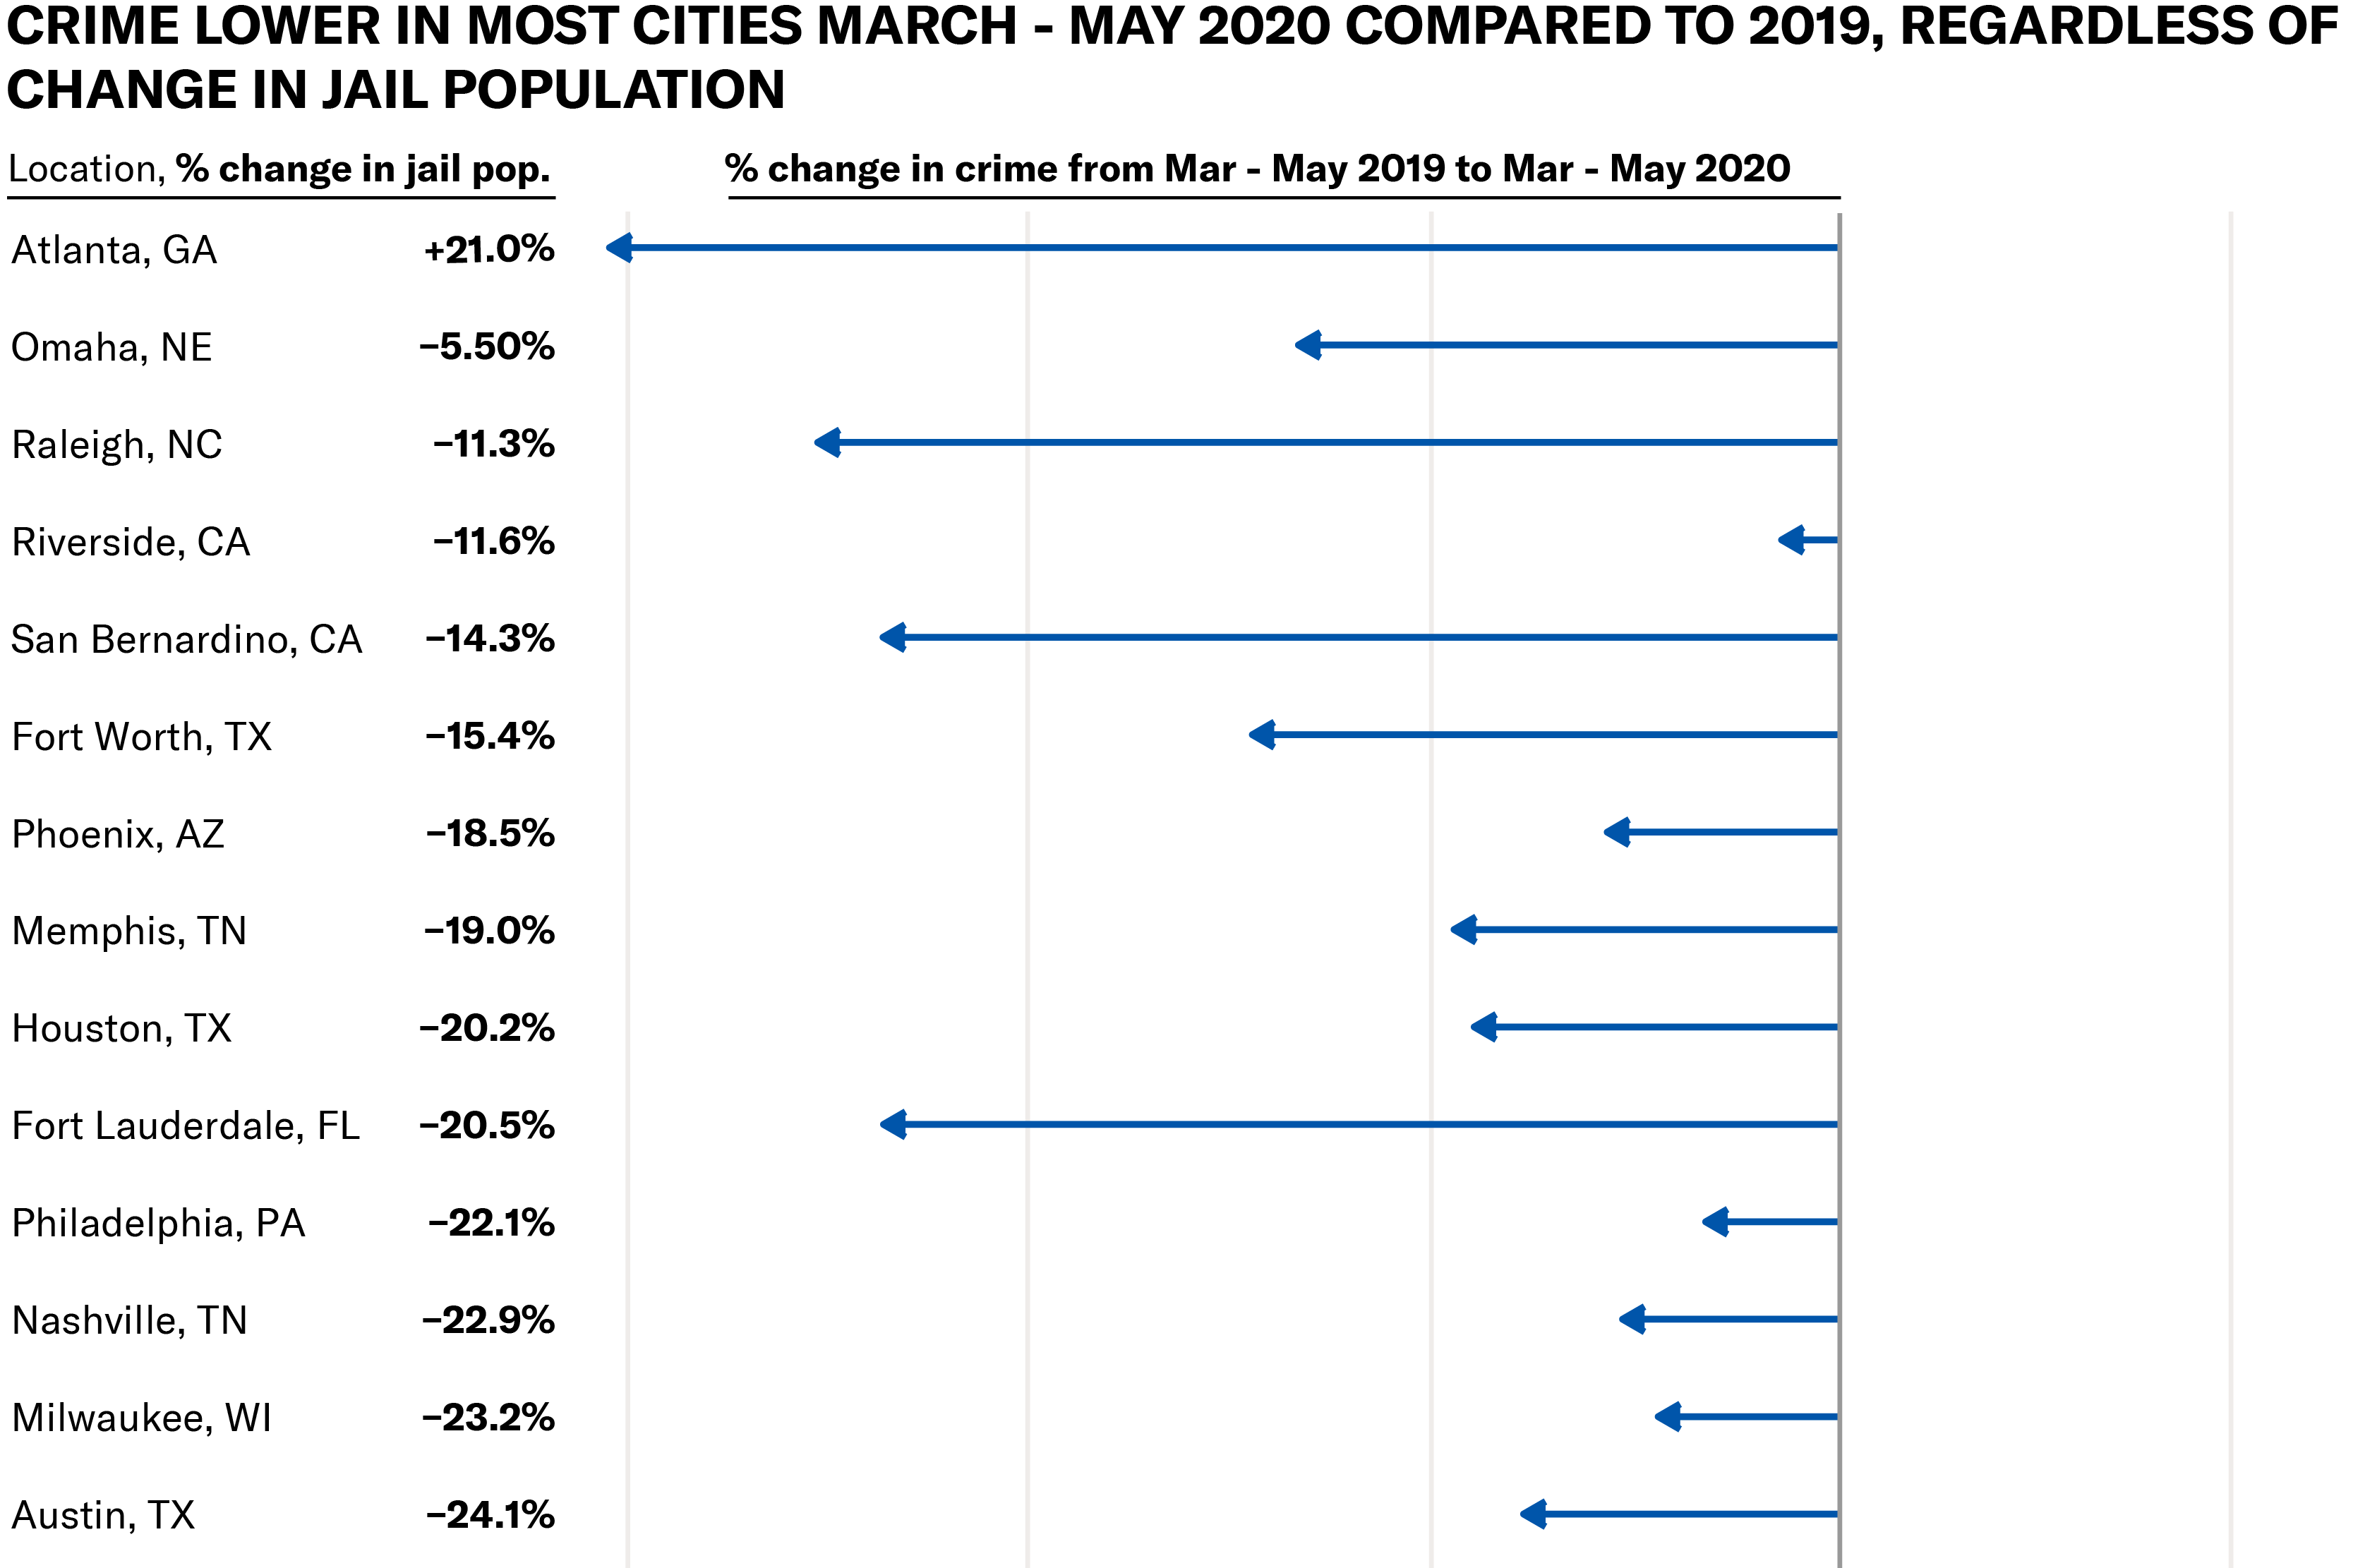
Note: Police data is often dynamic, and constantly updated based on new reports. Reported incidents may have changed since time of analysis (early July, 2020).
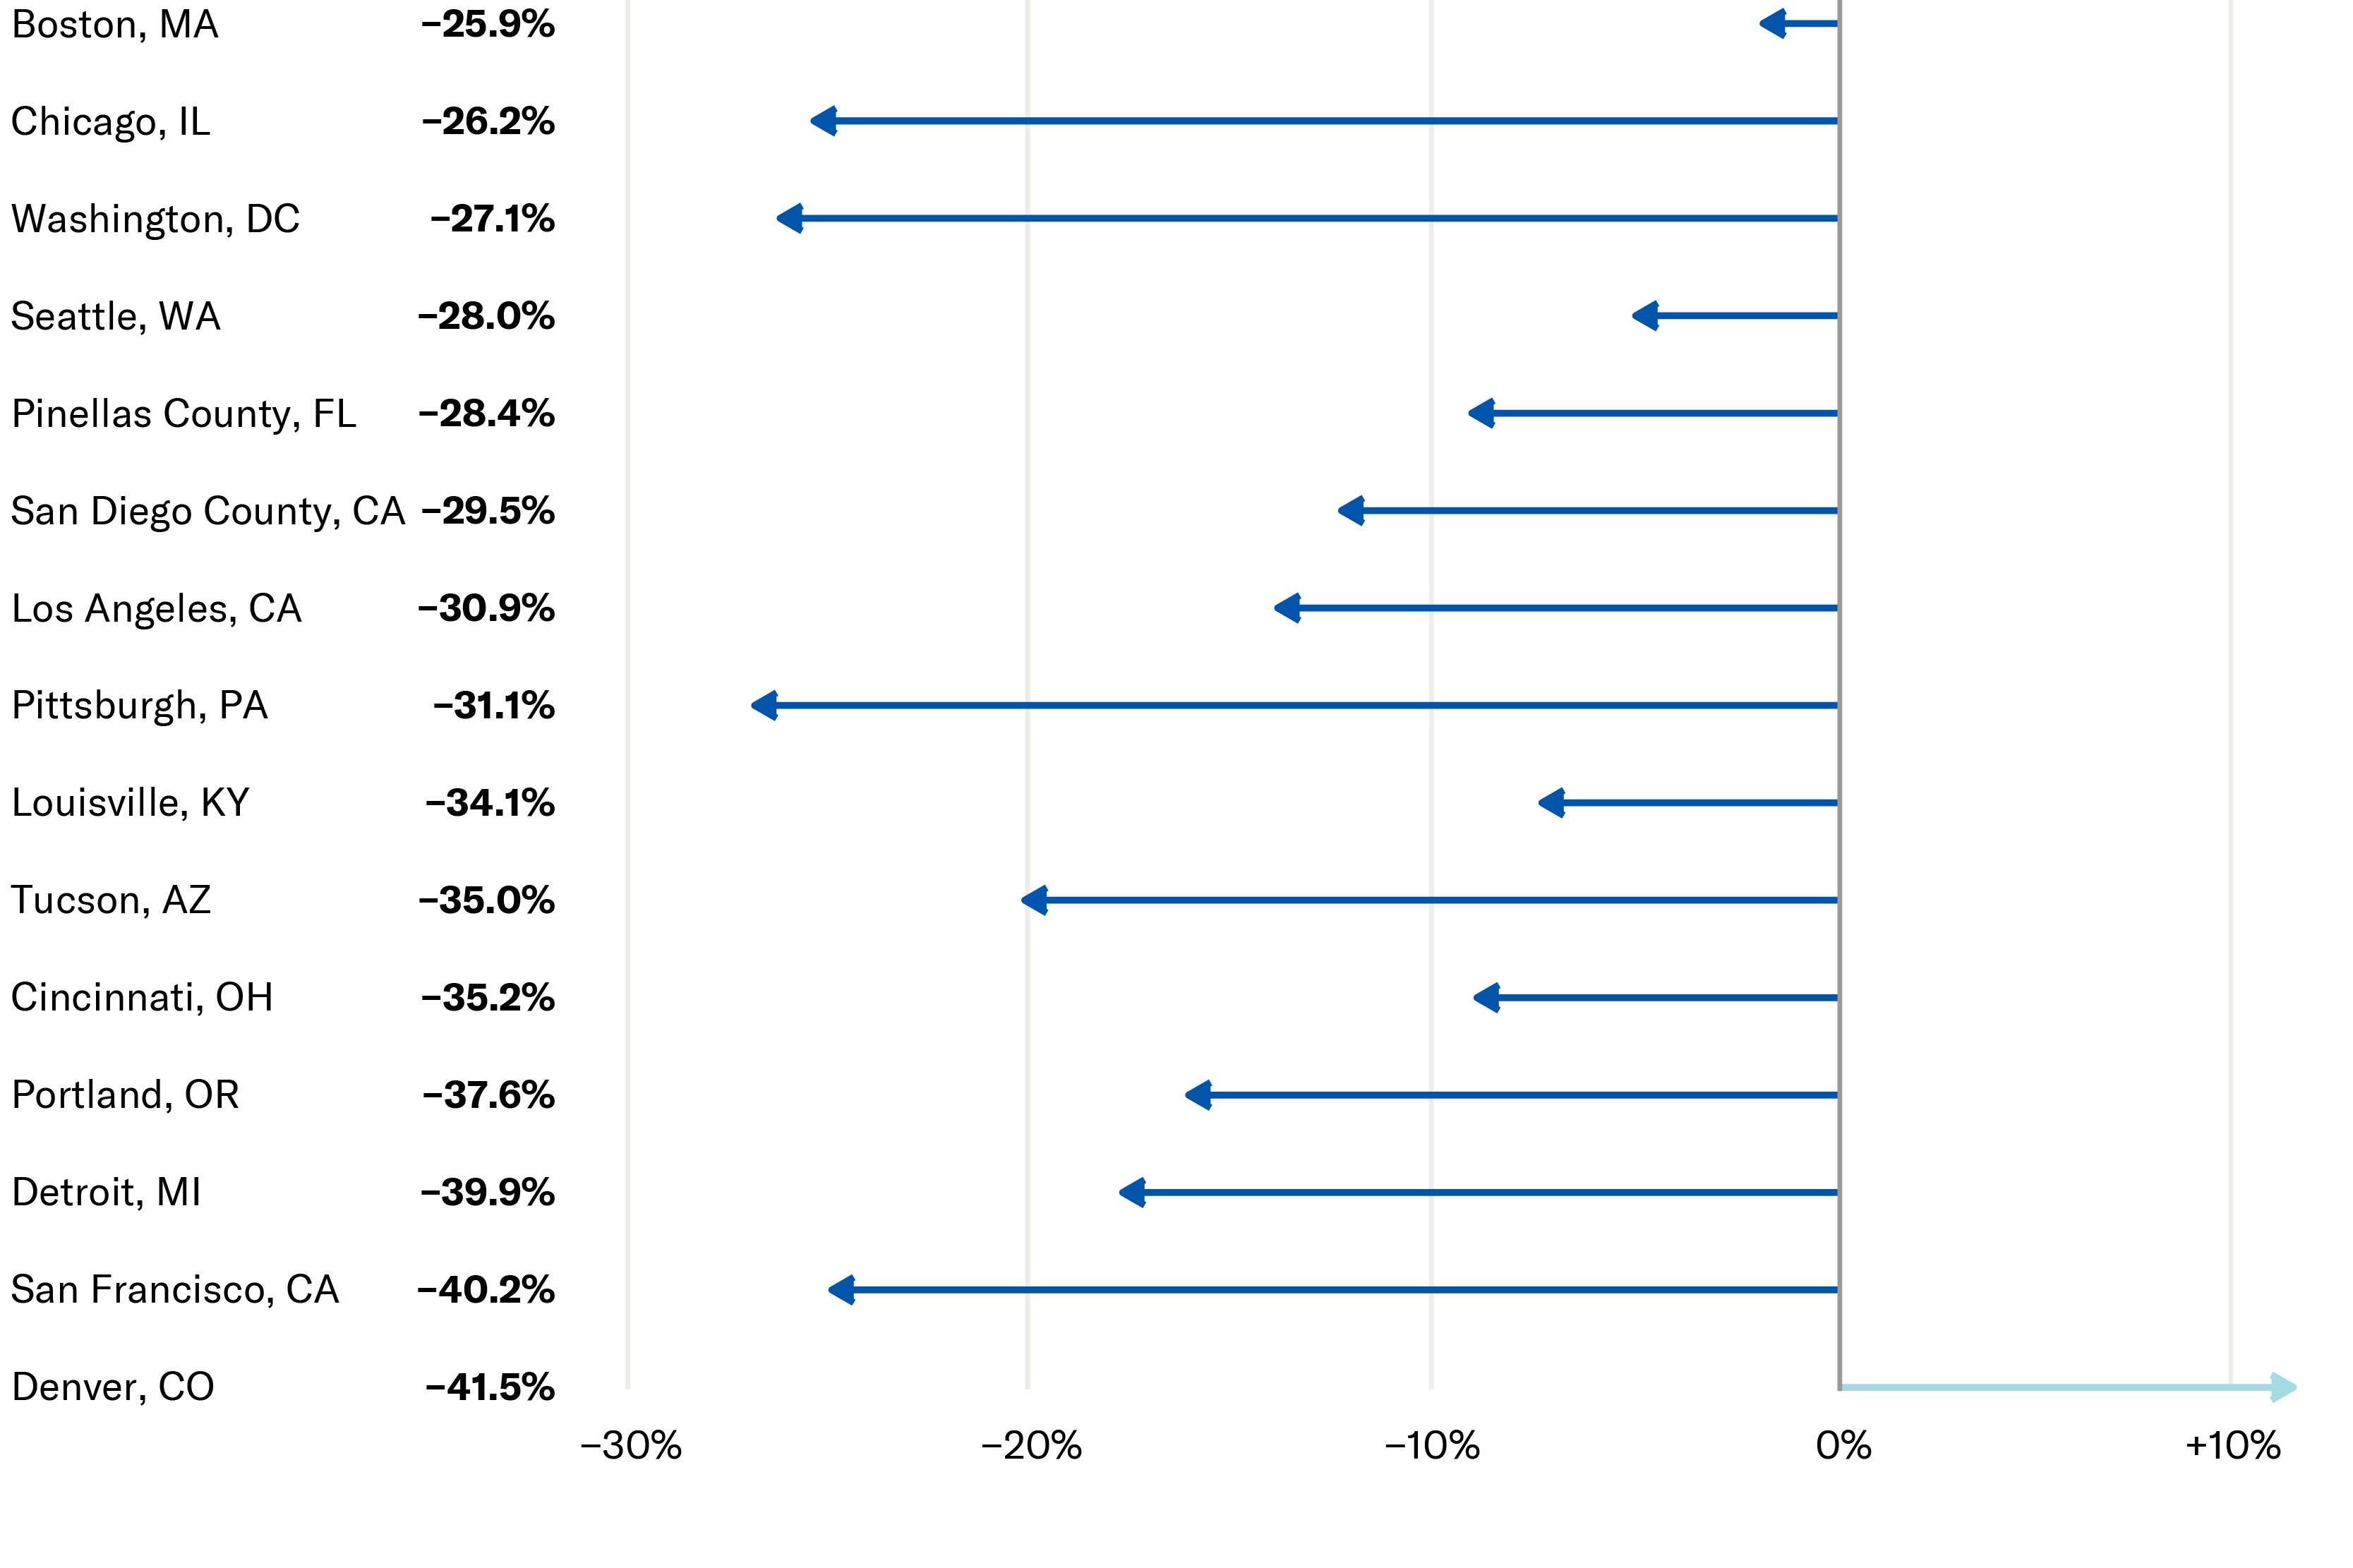
Note: Police data is often dynamic, and constantly updated based on new reports. Reported incidents may have changed since time of analysis (early July, 2020).
We found no evidence of any spikes in crime in any of the 29 locations, even when comparing monthly trends over the past two years. The release of incarcerated people from jails has saved lives both in jails and in the community, all while monthly crime trends were within or below average ranges in every city.
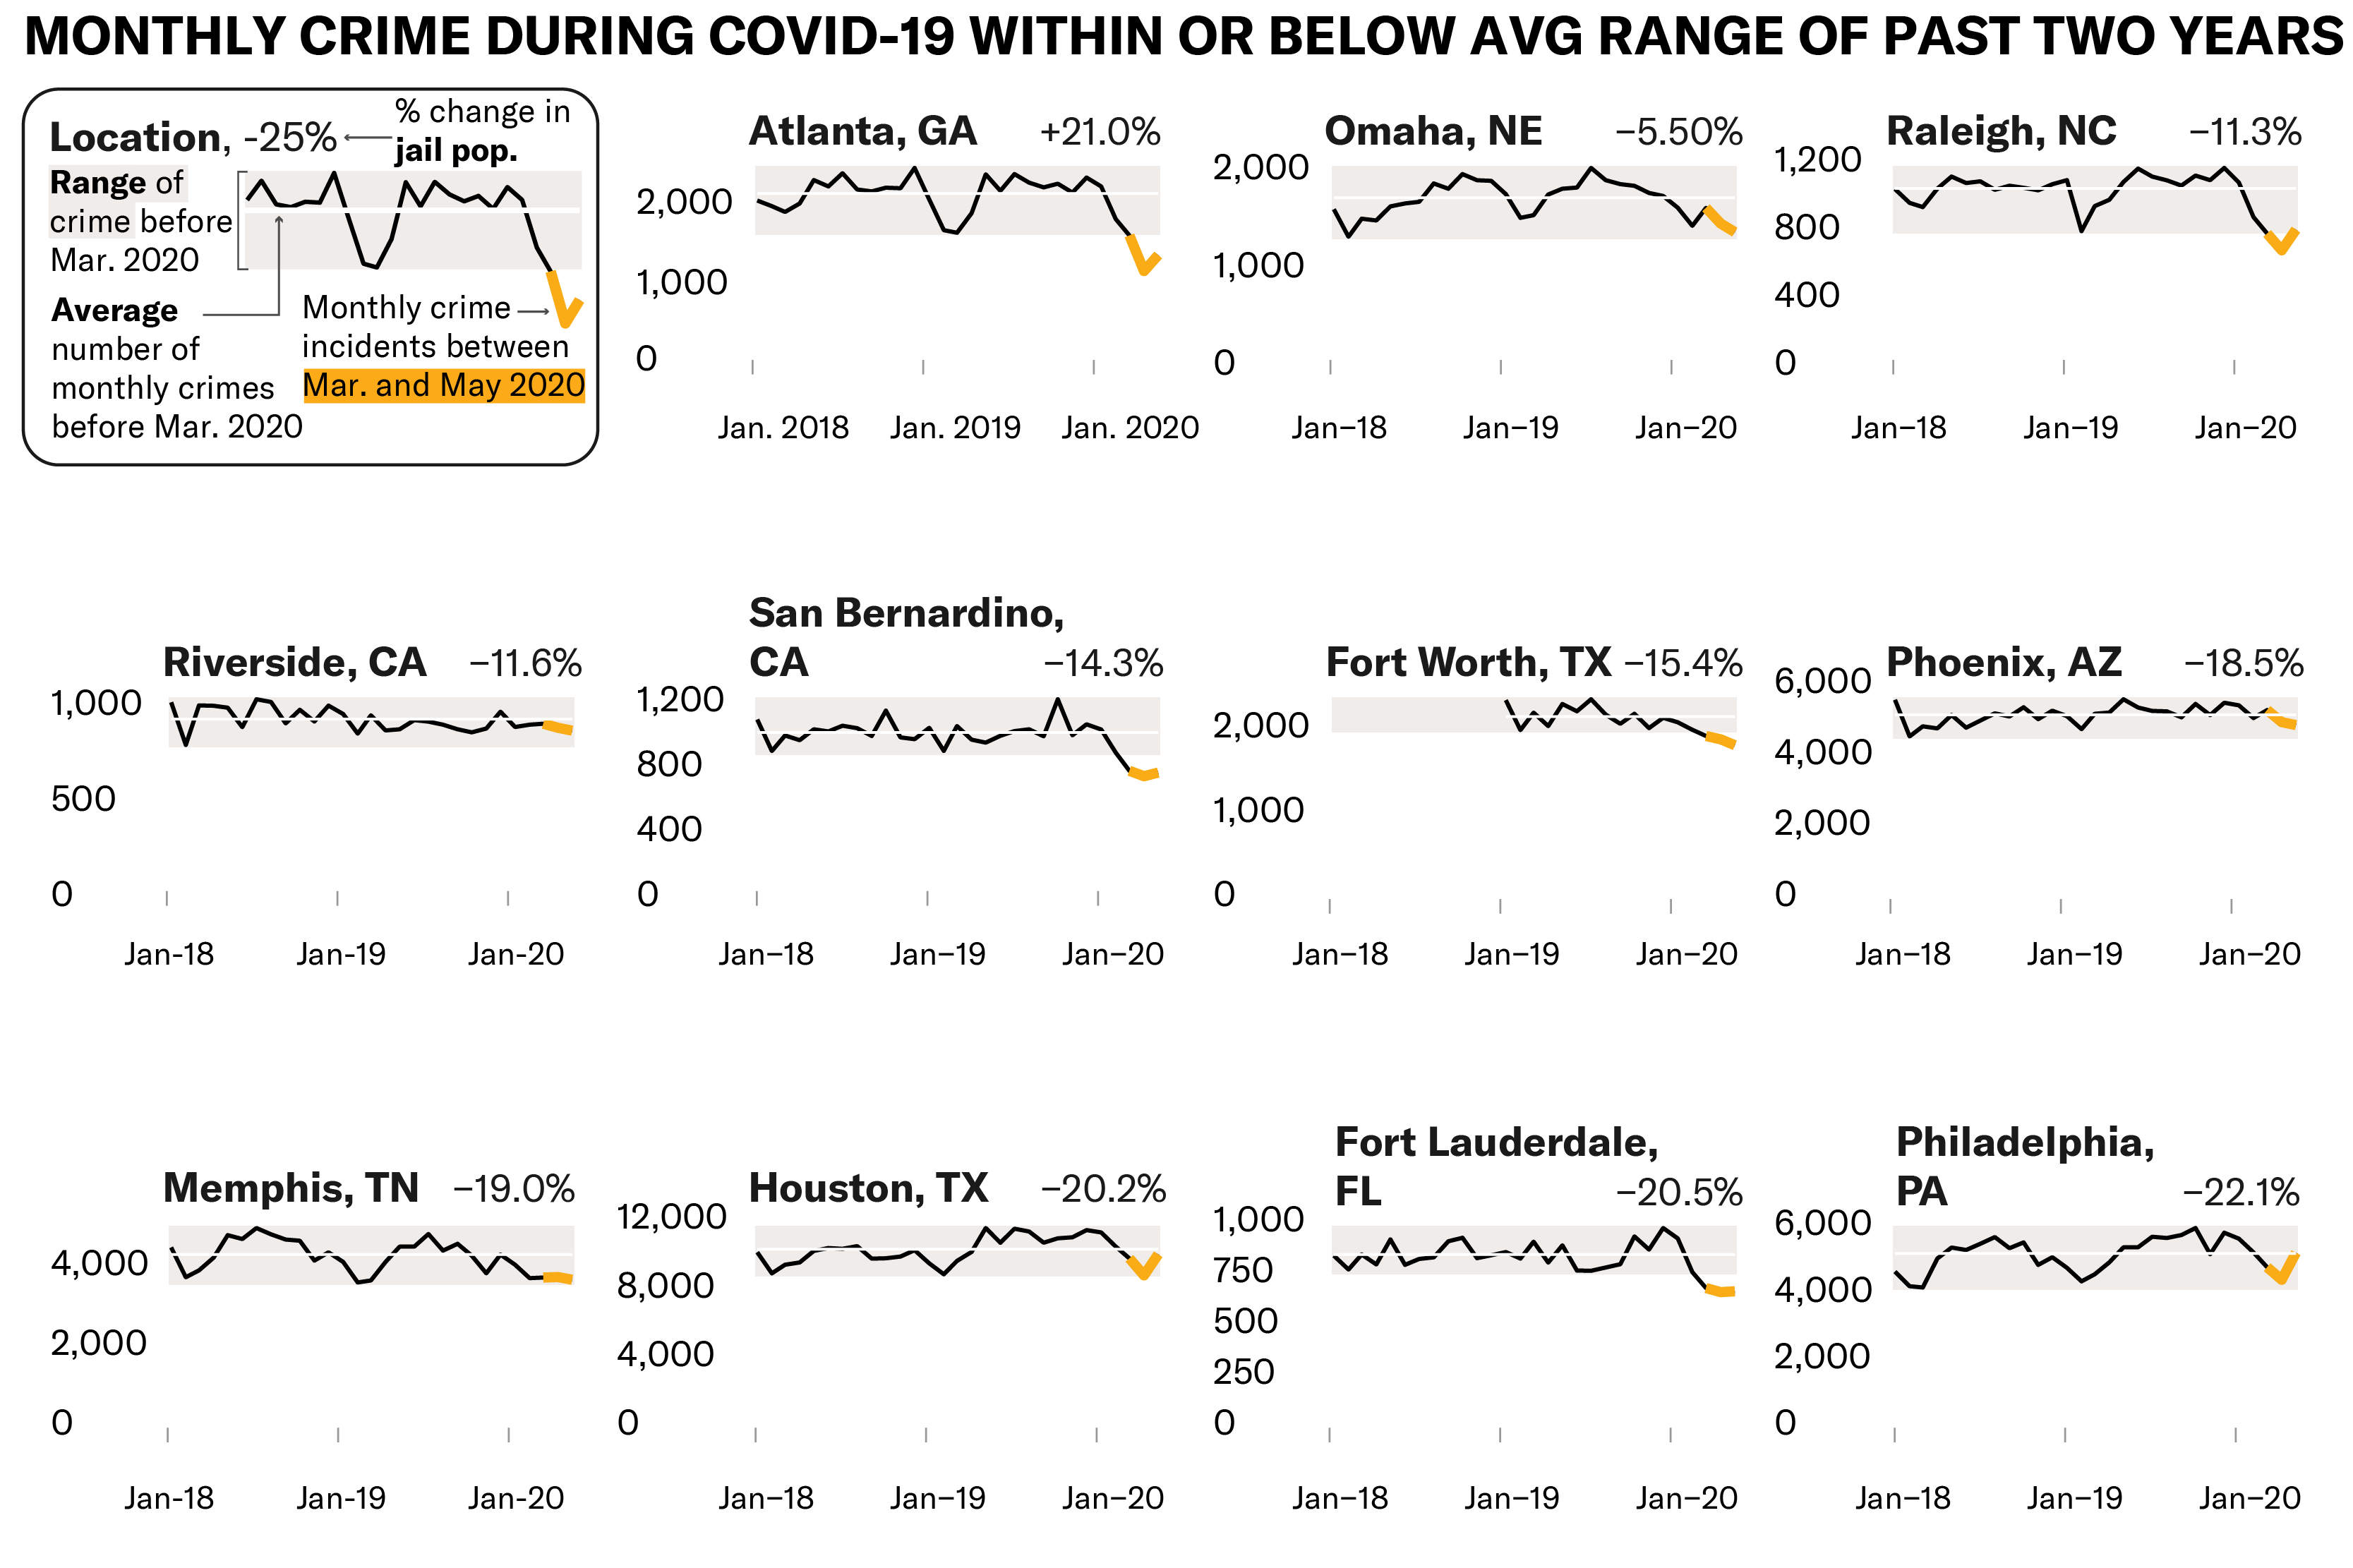
The team’s findings were in line with that documented certain types of crime have gone down during the COVID-19 pandemic, which many attribute to stay-at-home orders and decreased overall activity. City-level crime trends are complex and influenced by many factors, including , with crime rates typically rising in the summer months. The analysis confirmed that the amount by which a county changed its jail population wasn’t correlated with the amount of change in crime.
This confirmation comes at a time when reducing jail populations is urgently necessary. The epidemiological model the ņŌįń√ŇŅ™ĹĪĹŠĻŻ developed in partnership with academics in April illustrated the profound risk COVID-19 presents to people in carceral facilities and their surrounding communities. The model found that swift action to reduce jail populations could save lives, but inaction could lead to an estimated 100,000 deaths in jails and the surrounding communities. Since then, COVID-19 has continued to spread rampantly through , , and ‚ÄĒ more than 50,000 people in prison have tested positive for the coronavirus, and over 600 have died. has confirmed what we feared: Cycling through a jail is one of the largest risk factors for COVID-19 transmission. For Black and Brown people already disproportionately harmed by the criminal justice system, this system only exacerbates COVID-19‚Äôs unequal impact.
Arresting fewer people and releasing people from jail during a pandemic, as the 29 localities highlighted here have done, has undoubtedly saved lives in jails and in surrounding communities. What’s more, crime was lower this spring in nearly every location, and the amount of decarceration or incarceration appears uncorrelated with crime patterns. No state has gone far enough, and all should continue to reduce their jail, prison, and detention center populations, particularly for those who are most vulnerable. The potentially fatal threat of COVID-19 in jails and prisons, and the risk of transmission between jail staff and the surrounding populations, should be reason enough to release as many people as possible.
As states struggle to return to ‚Äúnormal,‚ÄĚ many life-saving policies are being quietly ended. California a statewide policy setting bail to $0 for low-level offenses, even as Los Angeles County continues to see of new coronavirus cases. The threat of COVID-19 is still very much alive, and it highlights the arbitrary nature of our criminal legal system. Any and all policies to reduce arrests in light of COVID-19 should extend indefinitely, and should not be replaced with a system of fines and fees.
The data shows: We don’t have to choose between public safety and public health. Reducing jail populations saves lives, and these reductions must continue.
METHODOLOGY
- We found crime data individually for each city or county. A spreadsheet tracking the datasets used for each location can be found .
- Because each location’s crime dataset was drawn from separate sources and contained varying categorizations of crime, crime patterns should not be compared between cities. Additionally, because police data is often dynamic and constantly updated based on new reports, incidents may have changed since the time of analysis (early July, 2020).
- We analyzed only ‚ÄúPart 1‚ÄĚ crimes () because they represent the offenses most likely to be consistently reported to the police. This classification was often manual, so should be viewed as estimates. Our code to clean and analyze the data can be found . Some cities report crime data at the offense level, which sometimes includes multiple rows of charges per incident; others report at the incident level, only identifying the individual‚Äôs highest offense, and other cities report their data already aggregated at the monthly incident level. For each location with daily data, we aggregated the number of incidents to the month level, using each set of data‚Äôs unique identifier to mark one incident of crime. For data with many missing or null unique identifiers, we created a unique identifier based on time, date, and location where possible to reasonably estimate.
- When calculating the percent change in crimes between 2020 and 2019, we used the average number of crimes between March and May for both years. One exception was Portland, OR, where data was only available through April 2020. We calculated the percent change using just March and April data for both years.
- We primarily used tracking of jail populations during COVID-19 to calculate incarceration/decarceration rates. We used the dates of 2/29/20 and 4/30/20 to look at change in jail populations. When jail population data on 2/29/20 and 4/30/20 was not available through Vera‚Äôs tracking or other public collection efforts, we obtained jail population numbers from local news reports. Date ranges of the ‚Äúdecarceration‚ÄĚ time periods in these localities and accompanying alternative data sources are available .
Learn More ņŌįń√ŇŅ™ĹĪĹŠĻŻ the Issues on This Page
-
Press ReleaseDec 2024

Smart Justice
ņŌįń√ŇŅ™ĹĪĹŠĻŻ Celebrates President Biden‚Äôs Clemency Announcement, Allowing Hundreds to Remain in Their CommunitiesņŌįń√ŇŅ™ĹĪĹŠĻŻ Celebrates President Biden‚Äôs Clemency Announcement, Allowing Hundreds to Remain in Their Communities
WASHINGTON ‚Äď President Biden heeded the calls of advocates and families today by granting commutations to close to 1,500 people who were released to home confinement at the height of the COVID-19 pandemic under the CARES Act and pardons to 39 additional people, including many veterans and women. The CARES Act, passed in 2020 in response to the COVID-19 pandemic, allowed certain groups of people to serve part of their sentences at home to mitigate the dangers of COVID-19 in federal prisons. Since then, thousands of people have been allowed to serve part of their sentences at home, securing jobs, reconnecting with loved ones, and reintegrating into their communities. The ņŌįń√ŇŅ™ĹĪĹŠĻŻ advocated for the CARES Act and has been urging President Biden to provide clemency to CARES Act release recipients since 2021, launching a six-figure ad buy, engaging grassroots supporters, filing FOIA litigation, and more. ‚ÄúWe are thrilled that President Biden has allowed people to remain with their families and communities, where they belong, said Cynthia W. Roseberry, director of policy and government affairs at the ņŌįń√ŇŅ™ĹĪĹŠĻŻ‚Äôs Justice Division. ‚ÄúThe CARES Act was an unprecedented experiment in decarceration, and the data tells us it was incredibly successful. Of the over 13,000 people released, more than 99 percent have safely and successfully reintegrated into their communities. We urge Congress to build on the remarkable success of the CARES Act and pass other decarceration policies that prioritize compassion, redemption, and public safety.‚ÄĚ ‚ÄúPresident Biden‚Äôs actions today also remind us of the incredible and unique power of executive clemency,‚ÄĚ Roseberry continued. ‚ÄúThe ņŌįń√ŇŅ™ĹĪĹŠĻŻ has long advocated for the categorical use of clemency to address unjust outcomes of the criminal legal system. While today‚Äôs announcement is wonderful, there is more to do in the final weeks before President Biden leaves office. We strongly urge President Biden to use his power to address this country's failed death penalty by commuting death row sentences.‚ÄĚ According to data the ņŌįń√ŇŅ™ĹĪĹŠĻŻ obtained this year through FOIA litigation, the vast majority (71.8 percent) of those on home confinement had less than one year remaining in their sentence. Almost a quarter (23.5 percent) of CARES Act clemency recipients are older than 61 and over half (59.4 percent) are people of color. ‚ÄúBiden's announcement today means I can finally breathe a sigh of relief after 3.5 years of living with the fear of being sent back to prison for no reason,‚ÄĚ said Won Lee, released on CARES Act home confinement in May 2021. ‚ÄúThe second chance I got through the CARES Act allowed me to take care of my aging parents, restart my career, pursue a graduate degree, and receive treatment for the cancer I was diagnosed with shortly after returning home. Today's decision means I will no longer have to live with the uncertainty and fear that I will be unjustly uprooted from my life and family, who now depend on me. I am incredibly grateful and thrilled to sleep soundly tonight knowing I'll remain at home.‚ÄĚ Learn more about the ņŌįń√ŇŅ™ĹĪĹŠĻŻ‚Äôs campaign to commute death row here: /campaigns-initiatives/president-biden-commute-the-row -
Press ReleaseSep 2024
Criminal Law Reform
+2 Issues
Judge Orders Supervision System in Washington, D.C. to Accommodate People with DisabilitiesJudge Orders Supervision System in Washington, D.C. to Accommodate People with Disabilities
WASHINGTON ‚Äď A federal court granted a preliminary injunction yesterday in a case filed on behalf of people with disabilities on parole and supervised release in Washington, D.C., ordering immediate action to address discriminatory conditions faced by the two named plaintiffs. The court also denied the government‚Äôs motion to dismiss, allowing the case to proceed. The case, brought by the ņŌįń√ŇŅ™ĹĪĹŠĻŻ, ņŌįń√ŇŅ™ĹĪĹŠĻŻ of D.C., Public Defender Service for the District of Columbia, and Latham & Watkins LLP, challenges the federal government‚Äôs post-conviction supervision system in Washington, D.C. for systematically ignoring the needs of people with disabilities, thereby setting them up for failure on supervision and putting them at constant risk of sanctions, including incarceration. As the court held in its decision, such accommodations are likely required under federal disability law, specifically the Rehabilitation Act of 1973. The preliminary injunction requires that the United States Parole Commission and the Court Services and Offender Supervision Agency (CSOSA), the two federal agencies responsible for supervision in D.C., assess what reasonable accommodations the two named plaintiffs require to have an equal opportunity to succeed on supervision, and provide all such required accommodations. ‚ÄúAbsent an injunction,‚ÄĚ the court‚Äôs decision reads, ‚Äúthe Parolees will be forced to participate in the Government‚Äôs supervision programs on an unequal footing just because of their disabilities.‚ÄĚ People on supervision in D.C. are required to comply with myriad and onerous rules. For people with disabilities, navigating these complex conditions is even more challenging. For example, Plaintiff Mr. Mathis ‚ÄĒ a 70-year-old military veteran with congestive heart failure that limits his ability to walk ‚ÄĒ struggles to travel throughout the city to attend frequent supervision meetings that often conflict with necessary medical procedures and hospitalizations. His supervision officer required him to wear an ankle monitor even after his doctor warned the monitor would jeopardize his health due to his heart condition. Plaintiff Mr. Davis, who lives with chronic pain stemming from third-degree burns as well as mental health conditions, also faces disability-related barriers getting to required meetings. Yet failing to meet any of these conditions, even something as simple as missing an appointment, can land a person back in jail or prison, even when no new criminal conduct is alleged. The court agreed that ‚Äúabsent immediate relief, the Parolees will face irreparable harm; namely, obstacles to success on supervision solely because of their disabilities, which expose them to downstream harms like revocation and reincarceration.‚ÄĚ The court did not decide whether it will ultimately certify a class that could yield relief for all people on supervision in D.C. who need accommodations. Instead, the court directed the parties to agree on a schedule for further proceedings on that issue. ‚ÄúThe undue hardships faced by people with disabilities on federal criminal supervision in the District of Columbia have gone unaddressed for too long,‚ÄĚ said Scott Michelman, legal director, ņŌįń√ŇŅ™ĹĪĹŠĻŻ of the District of Columbia. ‚ÄúThis decision is a victory for equal treatment and common sense.‚ÄĚ ‚ÄúThe Court‚Äôs opinion emphatically rejects the federal government's ‚Äėdo-nothing‚Äô policy for people with disabilities on supervision in Washington, D.C., who have been forced to navigate onerous requirements without accommodations for decades,‚ÄĚ said Allison Frankel, staff attorney with the ņŌįń√ŇŅ™ĹĪĹŠĻŻ Criminal Law Reform Project. ‚ÄúThis ruling ensures that our named Plaintiffs will have the accommodations they need to have a fair shot at completing parole and remaining in their communities.‚Äú ‚ÄúWe are thrilled the Court recognized that the Parole Commission and CSOSA must accommodate our clients‚Äô disabilities so that they have an equal opportunity to succeed on supervision,‚ÄĚ said Zo√© Friedland, staff attorney with the Public Defender Service for the District of Columbia. ‚ÄúWe will keep fighting to make this relief permanent and systemic so that all people on supervision have an equal chance to succeed.‚ÄĚ The decision on the preliminary injunction can be found here: /cases/mathis-v-united-states-parole-commission?document=Preliminary-Injunction-Opinion The complaint can be found here: /documents/w-mathis-v-united-states-parole-commission-complaint -
Press ReleaseJul 2024
Smart Justice
Just City And Legal Advocates Challenge Tennessee’s Unprecedented Bail LawJust City And Legal Advocates Challenge Tennessee’s Unprecedented Bail Law
MEMPHIS, Tenn. ‚ÄĒ Today, the ņŌįń√ŇŅ™ĹĪĹŠĻŻ (ņŌįń√ŇŅ™ĹĪĹŠĻŻ) Criminal Law Reform Project, ņŌįń√ŇŅ™ĹĪĹŠĻŻ of Tennessee, and Simpson Thacher & Bartlett LLP filed a lawsuit on behalf of Just City Memphis to challenge the constitutionality of Tennessee‚Äôs unprecedented new bail law, arguing that the law violates the Fourteenth Amendment by mandating unfair bail hearing procedures and discriminatory wealth-based detention. The law makes Tennessee the only state in the country to prohibit judges from considering whether people appearing before them will be able to pay for release. The new law, which went into effect on May 1, targeted successful bail reforms that Shelby County implemented following an agreement with the ņŌįń√ŇŅ™ĹĪĹŠĻŻ, ņŌįń√ŇŅ™ĹĪĹŠĻŻ of Tennessee, Just City, and other local advocates. The agreement required the examination of a person‚Äôs financial circumstances prior to any bail decision; individualized bail hearings with counsel no later than three days after a person‚Äôs arrest; and imposition of secured money bail only as a last resort. As a result, more people returned home to their communities while at the same time lowering the number of people rearrested for new crimes. By rolling back these reforms, the Tennessee legislature has created a two-tiered system of justice, leaving those who cannot afford to pay detained indefinitely, even if they are not a flight or safety risk. Meanwhile, those who face the same charges but can afford to pay money bail are freed until trial. ‚ÄúBail reform works, and it was working in Shelby County. More Tennesseans were returning home to live peacefully in their communities,‚ÄĚ said Trisha Trigilio, senior staff attorney for the ņŌįń√ŇŅ™ĹĪĹŠĻŻ. ‚ÄúThis shameful legislation targets low-income and marginalized Tennesseans for pointless jail time. We will not allow Tennessee lawmakers to end successful bail reform for political gain.‚ÄĚ "Our Constitution demands that judges make individualized determinations about pretrial release," said Josh Spickler, executive director at Just City. "This law prevents judges from doing that crucial work and results in the unnecessary detention of people who pose no risk to public safety because they can't afford to pay an arbitrary bail amount. That's not how our justice system is supposed to work." ‚ÄúWe don't have to choose between safety and justice; we can have both if we maintain a bail system that is evidence-based, fair, and constitutional.‚ÄĚ said Stella Yarbrough, legal director at the ņŌįń√ŇŅ™ĹĪĹŠĻŻ of Tennessee. ‚ÄúEveryone has a basic right to freedom, and this new law contradicts decades of constitutional precedent. Freedom for the wealthy and punishment for poor people of all races violates the Constitution and disproportionately impacts Black people and people with disabilities, while doing nothing to address the systemic causes of crime‚ÄĒlike poverty and lack of opportunity.‚ÄĚ Simpson Thacher & Bartlett LLP Litigation Partner Craig Waldman added, ‚ÄúTennessee‚Äôs law banning judges from considering an individual‚Äôs ability to pay bail is unfair and unconstitutional. The right to due process guaranteed under the Fourteenth Amendment is a bedrock of our justice system.‚ÄĚ Just City is an organization dedicated to fighting discrimination based on race, ethnicity, and income in Shelby County criminal proceedings, and has long advocated for pretrial practices that prioritize fair and sensible release decisions over a person‚Äôs ability to pay. Their lawsuit asks the court to declare that this new bail law violates the Fourteenth Amendment and requests a preliminary injunction that would prohibit the Shelby County Sheriff from enforcing this law. -
Press ReleaseJul 2024
Reproductive Freedom
+2 Issues
Court Rejects Attempt to Dismiss Case Seeking Accountability for Wrongful Prosecution of AbortionCourt Rejects Attempt to Dismiss Case Seeking Accountability for Wrongful Prosecution of Abortion
McALLEN, Texas ‚Äď A federal judge ruled today that a lawsuit seeking accountability for the unlawful investigation and prosecution of Lizelle Gonzalez can proceed, rejecting attempts by Starr County officials to have the case dismissed. Gonzalez, represented by Garza Martinez, the ņŌįń√ŇŅ™ĹĪĹŠĻŻ, and the ņŌįń√ŇŅ™ĹĪĹŠĻŻ of Texas was unlawfully arrested, jailed, and charged with murder after a medication abortion she had in 2022. The Starr County district attorney, assistant district attorney, and sheriff pursued and then obtained an unlawful indictment against Gonzalez even though they knew that Texas law clearly prohibits the criminal prosecution of pregnant women for conduct that ends their pregnancy. ‚ÄúWhen I first heard Lizelle‚Äôs story, I was outraged at the behavior of our elected officials,‚ÄĚ said Cecilia Garza, attorney at Garza Martinez. ‚ÄúThe court‚Äôs decision today to allow this case to proceed gives me hope that courts will not allow these types of egregious acts to continue. Law enforcement need to be held accountable to the laws that they took an oath to uphold.‚ÄĚ In the motions to dismiss, the prosecutors and sheriff raised claims of legal immunity, a doctrine that they argue should insulate them from being held accountable for violating Gonzalez‚Äôs constitutional rights. The court denied their motions to dismiss, allowing Gonzalez‚Äôs case to proceed to the first stage of discovery concerning whether law enforcement can be held liable for violating her rights. ‚ÄúImmunity doctrine creates a culture in police departments and prosecutor offices where public officials may feel empowered to violate people‚Äôs rights, knowing they will face few ‚Äď if any ‚Äď consequences,‚ÄĚ said Lauren Johnson, director of the ņŌįń√ŇŅ™ĹĪĹŠĻŻ‚Äôs Abortion Criminal Defense Initiative. ‚ÄúWhile immunity often obstructs victims of misconduct from attaining accountability, the court‚Äôs decision today to allow the case to proceed will give Lizelle a chance to pursue the justice she deserves for being unlawfully targeted and prosecuted.‚ÄĚ ‚ÄúTexas is one of the most restrictive states in the country when it comes to abortion health care, but even in Texas, the laws are uniform and clear that pregnant women cannot be criminally liable for having an abortion,‚ÄĚ said David Donatti, senior staff attorney for the ņŌįń√ŇŅ™ĹĪĹŠĻŻ of Texas. ‚ÄúWe expect and demand that our elected officials follow the rule of law, and that is especially true for officials elected to enforce the laws with so much power over our daily lives and personal decisions.‚ÄĚ